
Figure 5.
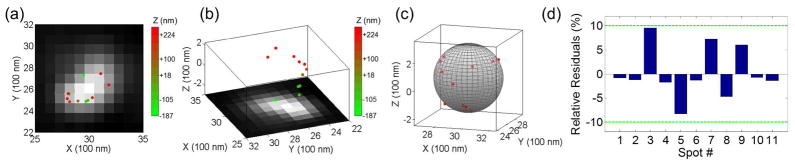
QDB3 applied on quantum dots immobilized on a microsphere of diameter 400 – 690 nm. (a–b) 3D super-resolution images of the quantum dots overlapped on normal images from microscope in different views. The relative z positions of the quantum dots are indicated with color from red (high z) to green (low z). (c) The positions of the quantum dots are fitted to a sphere, resulting in a fitted diameter of 480 nm. The fitted sphere is shown as a gray and the detected quantum dots are drawn as red dots. (d) Relative residuals in the radial direction of the spherical fitting show that the fitting errors are small, < 10%.