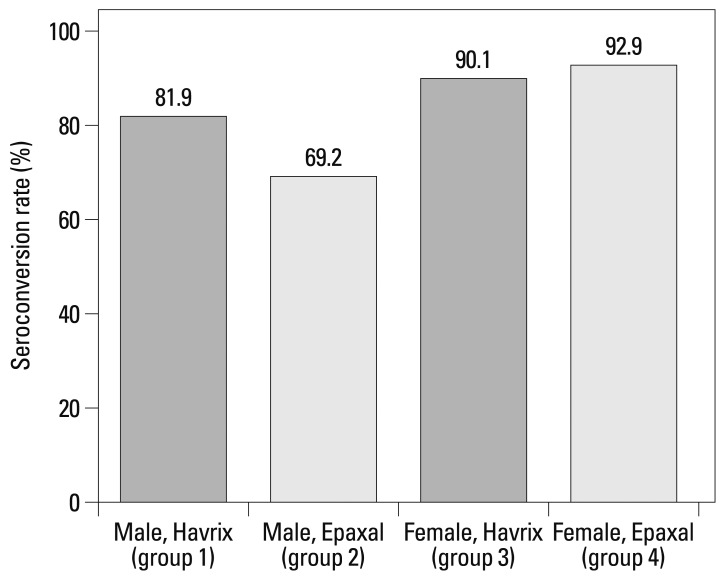
Fig. 1.
Effect of gender and vaccine type on seroconversion rates. p value for the difference between groups 1 and 2=0.012, p value for the difference between groups 3 and 4=0.552, p value for the difference between groups 1 and 3=0.105, p value for the difference between groups 2 and 4 <0.001, and p value for the interaction between gender and vaccine type adjusted by age, gender, obesity, drinking, smoking, vaccine type, and follow-up time=0.062.

