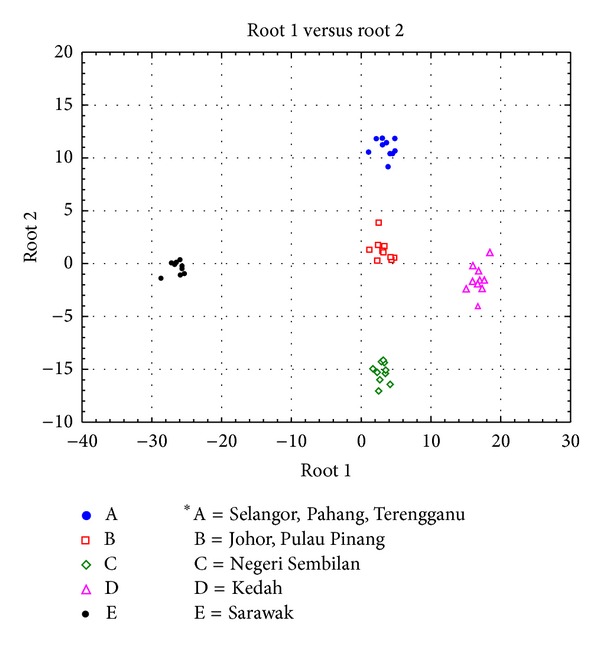
Figure 6.

Multivariate discriminant analysis based on 8 locations plotted on root 1 and root 2 axes. The two discriminant traits that contribute most to the variance underlined by each root are referred to as the coefficient values listed in Table 6.
