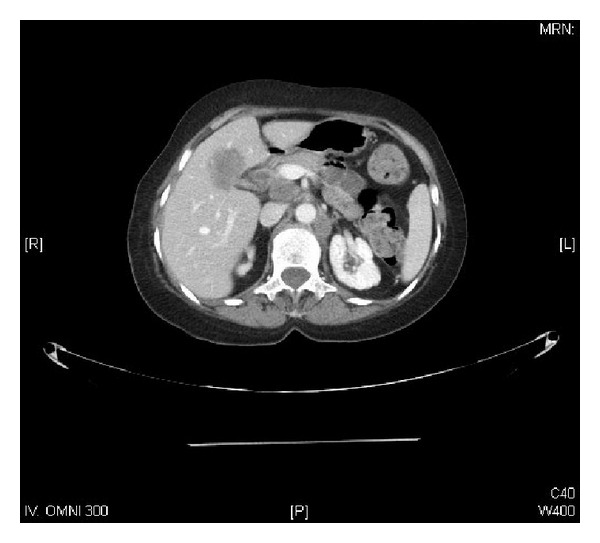
Figure 2.

Postchemotherapy abdominal CT showing interval regression of the known masses around the GB, portocaval, aortocaval, and left paraaortic stations by about 35–45%.

Postchemotherapy abdominal CT showing interval regression of the known masses around the GB, portocaval, aortocaval, and left paraaortic stations by about 35–45%.