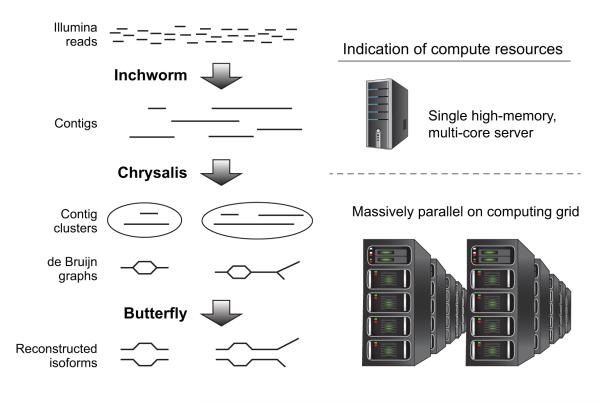
Figure 1. Overview of Trinity assembly and analysis pipeline.
Shown are the key sequential steps in Trinity (left) and the associated compute resources (right). Trinity takes as input short reads (top left) and first uses the Inchworm module to construct contigs. This requires a single high-memory server (~1G RAM per 1M paired reads, but varies based on read complexity; top right). Chrysalis (middle left) clusters related Inchworm contigs, often generating tens to hundreds of thousands of Inchworm contig clusters, each of which is processed to a de Bruijn graph component independently and in parallel on a computing grid (bottom right). Butterfly (bottom left) then extracts all probable sequences from each graph component, which can be parallelized as well.

