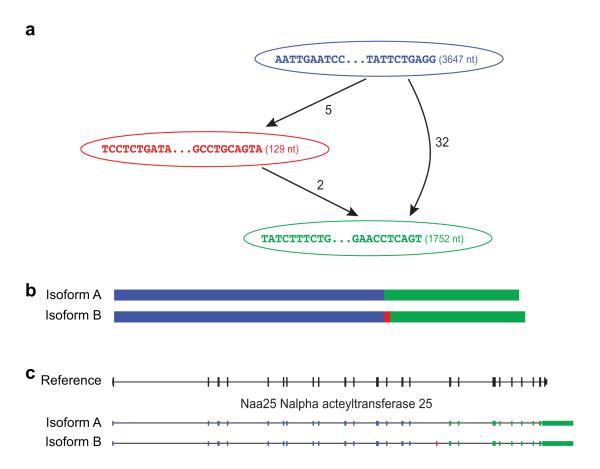
Figure 5. Transcriptome and genome representations of alternatively spliced transcripts.
Shown is an example of the graphical representation generated by Trinity’s Butterfly software (a) along with the corresponding reconstructed transcripts (b) and their exonic structure based on the alignment to the mouse genome (c). Each node in the graph (a) is associated with a sequence, and directed edges connect consecutive sequences from 5′ to 3′ in the same transcript. Bulges (bifurcations) indicate sequence differences between alternative reconstructed transcripts, including alternatively spliced cassette exons; only a single bulge is shown in this transcript graph. Edges are annotated by the number of RNA-Seq fragments supporting the transcript from the 5′ sequence to the 3′ one. In this example, there are two supported paths: one from the blue to the green node (supported by 32 fragments) yielding ‘isoform A’ (b, top), and the other from the blue to the red to the green node, supported by at most 5 fragments, yielding ‘isoform B’ (b, bottom). The red node is a result of an alternatively skipped exon, as apparent in the gene structure (c, red bar, shown in ‘isoform B’). Navigable transcript graphs are optionally generated by Butterfly, provided in ‘dot’ format and can be visualized using graphviz (http://graphviz.org). These details are provided on the Trinity website (http://trinityrnaseq.sourceforge.net/advanced_trinity_guide.html).

