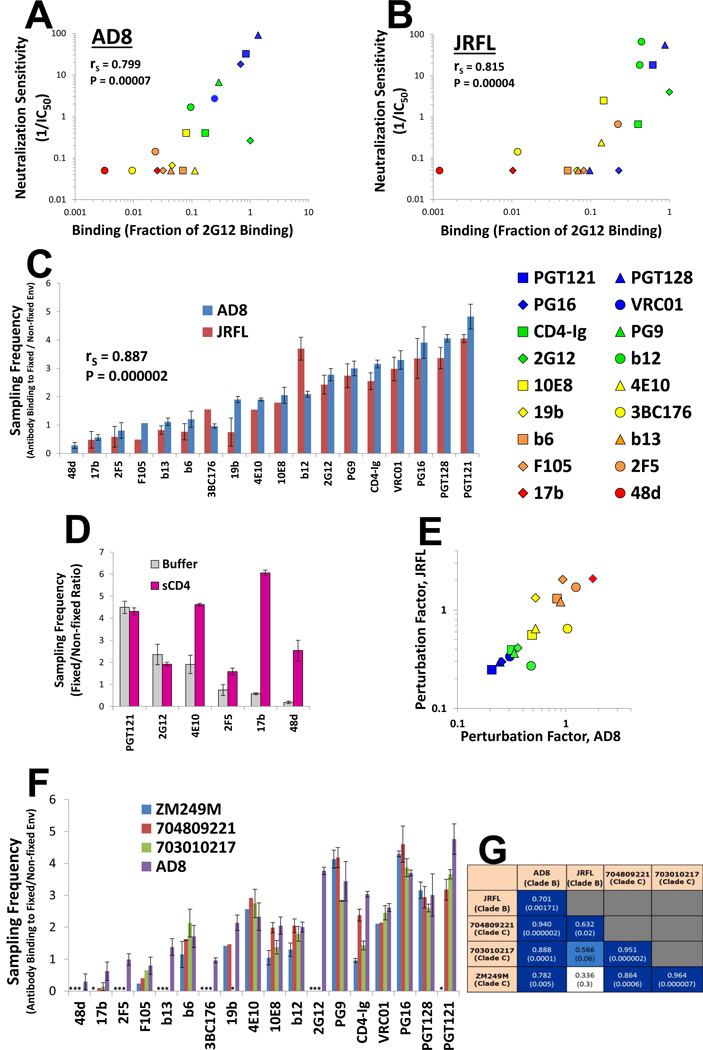
Figure 1. Ab Interaction with Primary HIV-1 Env Trimers.
(A,B) Correlation between binding of monoclonal Abs and CD4-Ig (at 2 µ;g/ml) to the indicated cell-surface Envs and the reciprocal of the Ab concentration (in µ;g/ml) required for half-maximal inhibition of the infection of viruses with the same Envs. Binding of each Ab is expressed as a fraction of the binding of the 2G12 Ab (at 2 µ;g/ml) to Env. (C) Sampling frequency of the Env conformations competent for binding the indicated monoclonal Abs and CD4-Ig. Error bars, SEM. (D) Effect of sCD4 binding (15 µ;g/ml) on the AD8 Env sampling frequency associated with the indicated Abs. For the absolute binding values, see Figure S1C. (E) Correlation between the PF values measured for each Ab on the AD8 and JRFL Envs. The 48d Ab is excluded from this correlation due to the low binding values for the JRFL Env. The symbols are color coded based on PF (blue = low, red = high). Spearman rank-order correlation coefficient, rS; P-value, two-tailed T-test. (F) PF values for the panel of Abs measured on the AD8 and three clade C HIV-1 Envs. Asterisks represent sampling frequencies that could not be calculated due to undetectable Ab binding to that Env. (G) Spearman rank-order coefficients for correlations between PF values of the Ab panel, measured on clade B and C HIV-1 Envs. P values are indicated in parentheses and the boxes are color coded according to the strength of the correlation. Data are represented as mean +/− SEM. Figure 1 is related to Figure S1.

