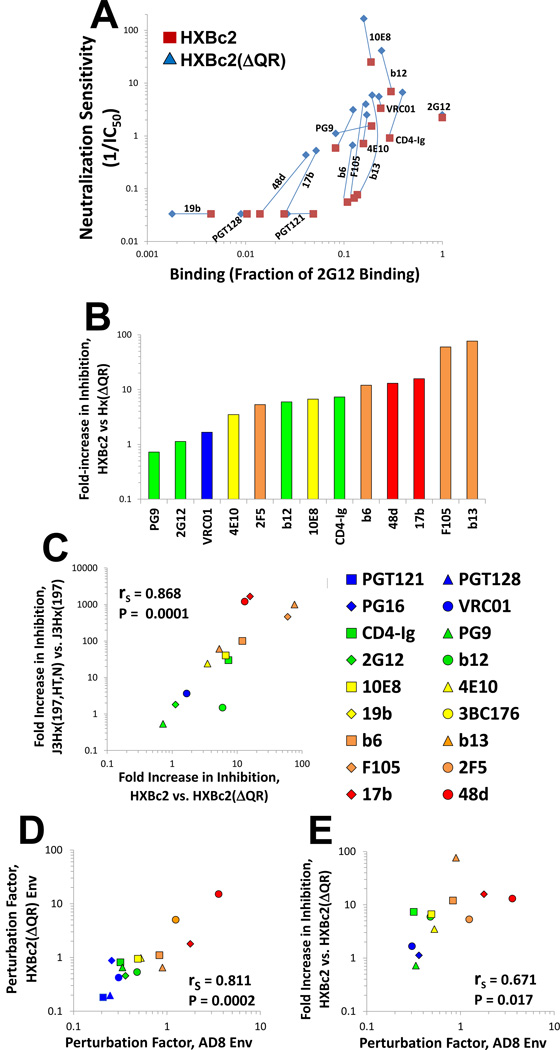
Figure 4. Ab-Env Binding, PF and Neutralization of HXBc2 Variants with Different ER Values.
(A) Relationship between Ab binding and inhibition of the high-ER HXBc2 Env and the low-ER HXBc2(AQR) Env. Abs that had a measured IC50 value greater than 30 µ;g/ml were assigned a neutralization value of 0.03. (B) Fold increase in neutralization sensitivity (1/IC50) of virus containing the HXBc2 Env relative to the HXBc2(AQR) Env for the indicated Abs and CD4-Ig. The colors of the bars indicate the PF values of the Abs, measured on the AD8 Env. (C) Correlation between the effects of ER on inhibition by each Ab for the J3Hx(197,HT,N)-J3Hx(197) pair and the HXBc2-HXBc2(AQR) pair. (D) Correlation between the PF values measured on the AD8 and HXBc2(AQR) Envs. (E) Correlation between PF of Abs measured on the HXBc2(AQR) Env and fold increase in neutralizing potency (1/IC50) for HXBc2(AQR). Abs are colored according to PF values, measured on the AD8 Env. Spearman rank-order correlation coefficient, rS; P value, two-tailed T-test. Figure 4 is related to Figure S2.

