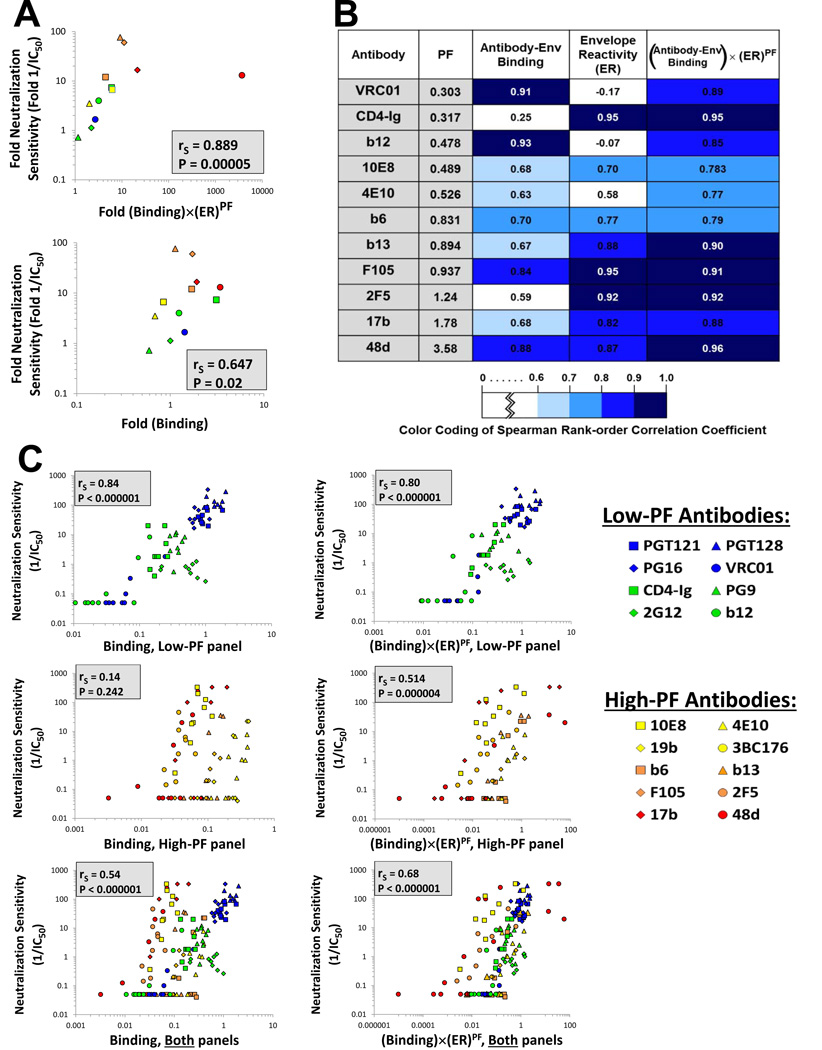
Figure 5. Explanatory Capability of Different Models of HIV-1 Neutralization.
(A) Correlations between the measured relative neutralization sensitivity of HXBc2 and HXBc2(AQR) viruses and the relative neutralization sensitivity predicted by a model based on Equation 2 (top panel) or a model based only on Ab-Env binding (bottom panel). (B) Correlations between predicted and measured levels of inhibition. Nine closely-matched variants of the AD8 Env that differ in ER were tested for their sensitivity to each of the indicated Abs. For each Ab, we show the correlation between the measured neutralization sensitivity and the neutralization sensitivity predicted by models based on Ab-Env binding alone, ER alone, or the multiple parameters in Equation 2. Spearman rank-order correlation coefficients are reported and are colored according to the strength of the correlation, as detailed in the key. (C) Correlations between the measured neutralization sensitivity of the nine AD8 variants to the low-PF Abs (upper row) and the high-PF Abs (lower row) and the neutralization sensitivity predicted by a model based on Ab-Env binding alone (left panels) or based on Equation 2 (right panels). To allow a quantitative comparison of the neutralization obtained with different Abs, all data for each Env variant are expressed as the fold change in the measured or calculated value relative to the value obtained for the AD8 Env, which is assigned a value of 1. Spearman rank-order correlation coefficient, rS; P value, two-tailed T-test. The PF values of the Abs used for the calculations in this figure were measured on the AD8 Env.

