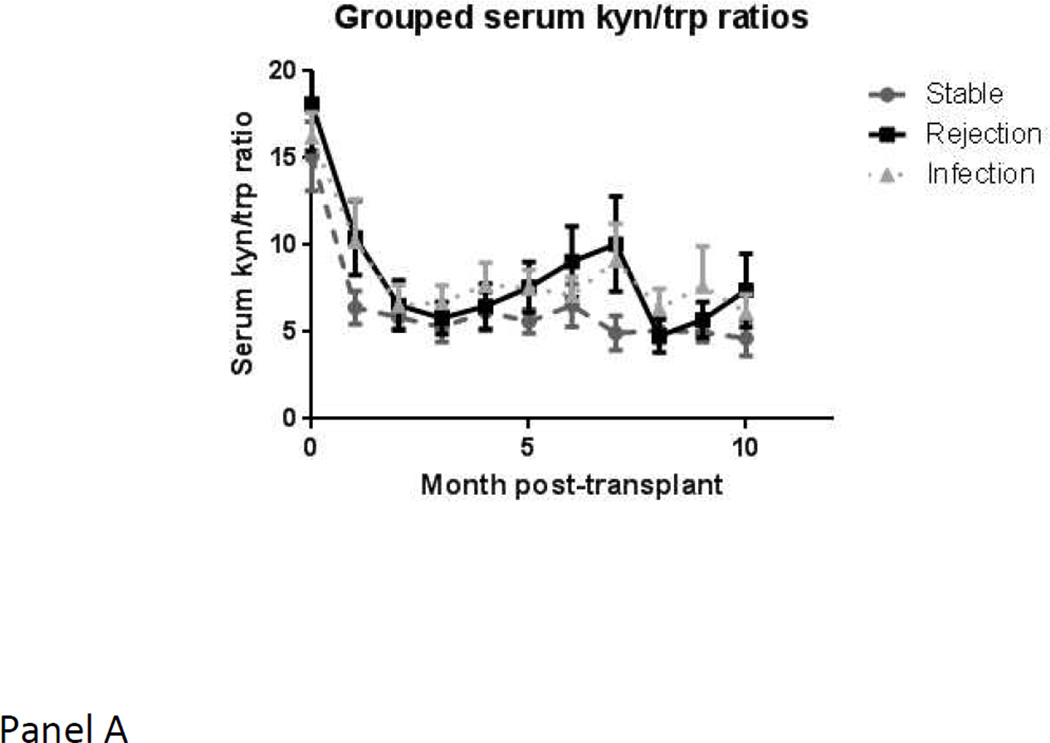
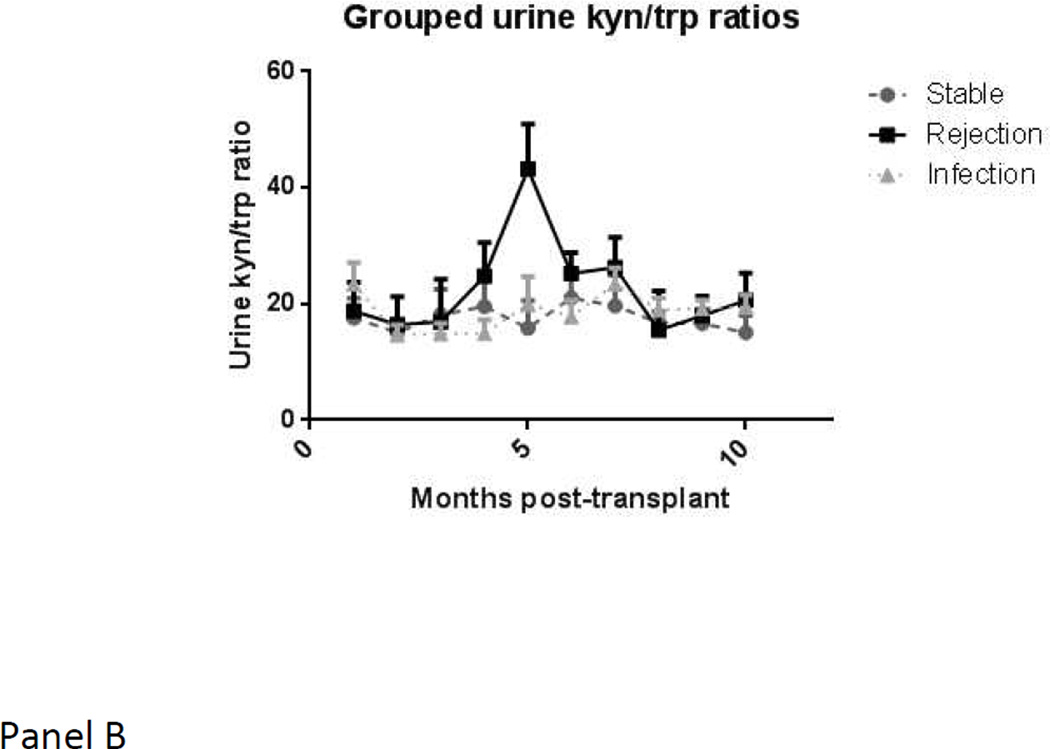
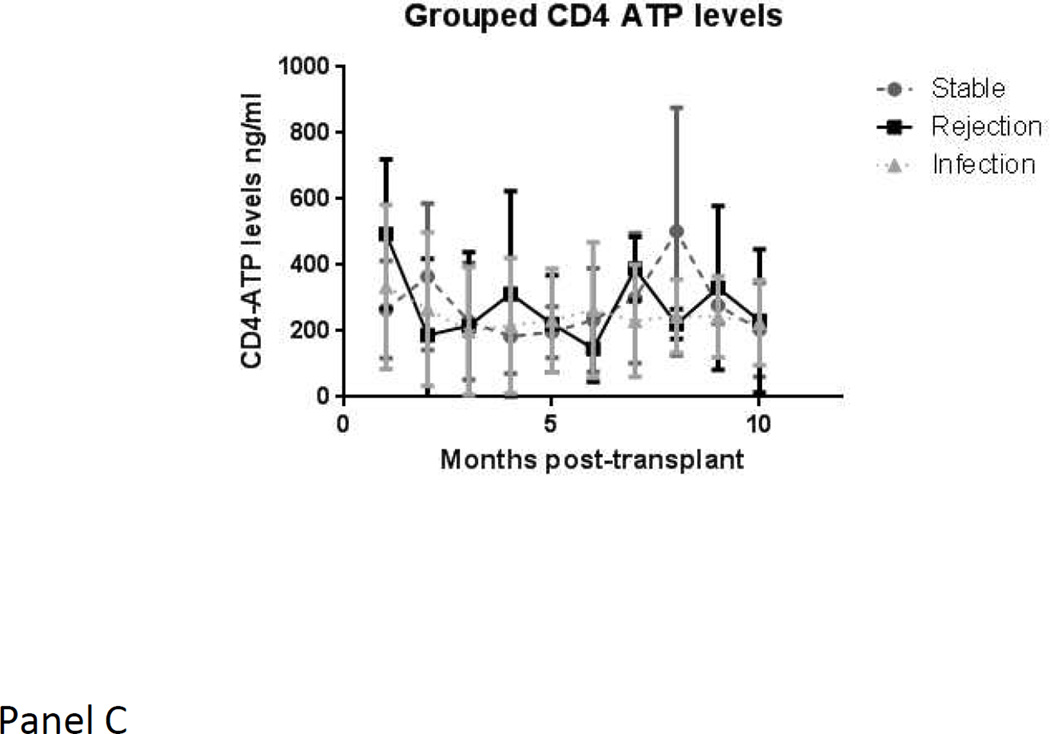
Figure 2.
a. Serum kyn/trp ratios over time in the three groups (stable group in grey circles with dashed lines, rejection group in black squares with solid lines, infection group in grey triangles with dotted lines)
b. Urine kyn/trp ratios over time in the three groups (stable group in grey circles with dashed lines, rejection group in black squares with solid lines, infection group in grey triangles with dotted lines)
c. Blood CD4-ATP levels over time in the three groups (stable group in grey circles with dashed lines, rejection group in black squares with solid lines, infection group in grey triangles with dotted lines)


