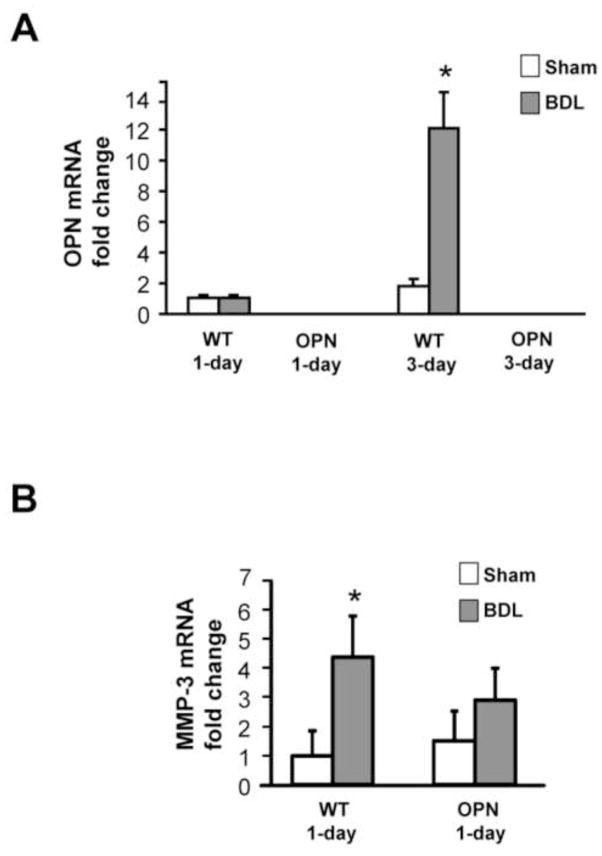
Figure 3.
Real-time RT-PCR analysis of OPN and MMP-3. Real-time PCR was performed on 5 individual samples per group, and the results were normalized to β-actin. Data from sham-operated 1-day WT were set as 1 and the results of the BDL animals were expressed as fold increase over controls (A and B). Data represent means ± SE of 5 animals per group. *P<0.05 compared with sham. #P<0.05 compared with vehicle.

