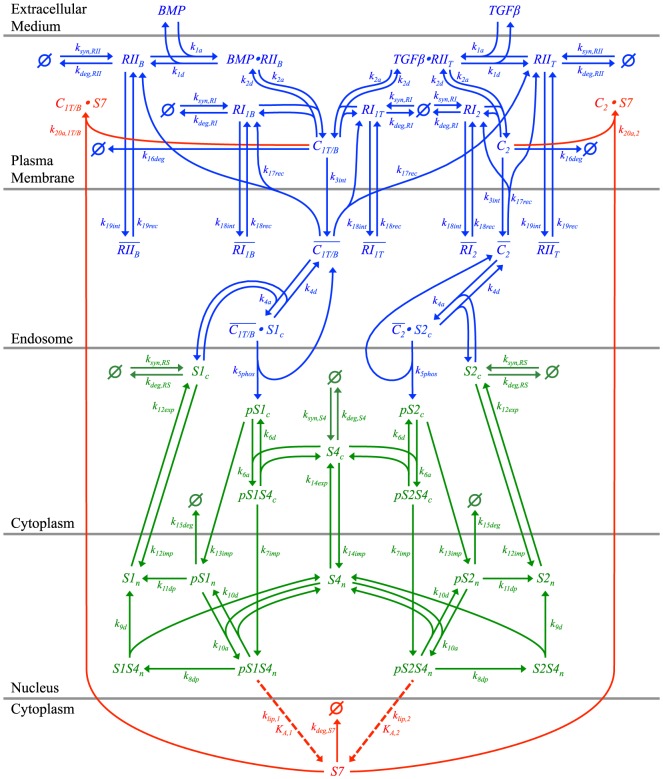
Figure 1. Schematic illustration of Smad-dependent TGF-β signal transduction pathway model.
Arrows indicate reaction steps along the pathway and are labeled with the rate constant for the reaction. Dashed arrows denote Smad7 synthesis through gene expression. We use overbars to represent internalized receptor species in the endosome and the symbol “/” to indicate “or” in grouping the C1T and C1B ligand-receptor complexes as C1T/B. Different colors group the three modules, where blue indicates receptor trafficking, green indicates Smad nucleocytoplasmic shuttling, and red indicates negative feedback.

