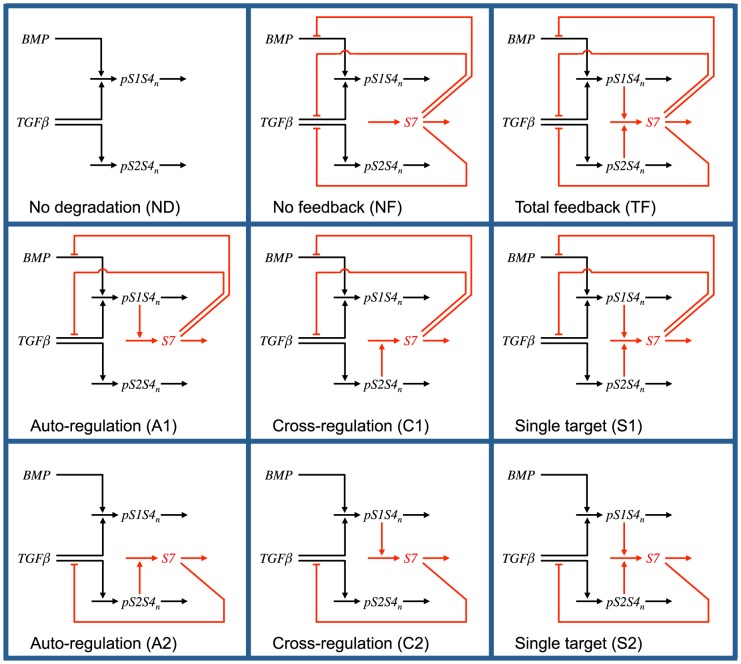
Figure 2. Schematic representation of the nine negative feedback loop network motifs.
Horizontal arrows represent mass flow into and out of a species. Vertical arrows and flat-head lines terminating on a horizontal arrow denote activation or repression, respectively, of the targeted process. Processes common to all network motifs are drawn in black, while the unique negative feedback loop processes are colored red.

