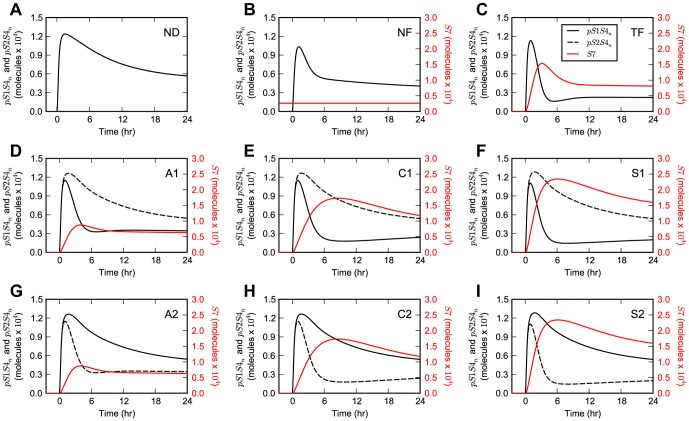
Figure 3. Model dynamics for stimulation with TGF-β.
Simulation results upon single-ligand stimulation with TGF-β for the (A) ND, (B) NF, (C) TF, (D) A1, (E) C1, (F) S1, (G) A2, (H) C2, and (I) S2 network motifs. The simulation results of pS1S4n, pS2S4n, and S7 are displayed as black solid lines, black dashed lines, and red solid lines, respectively.

