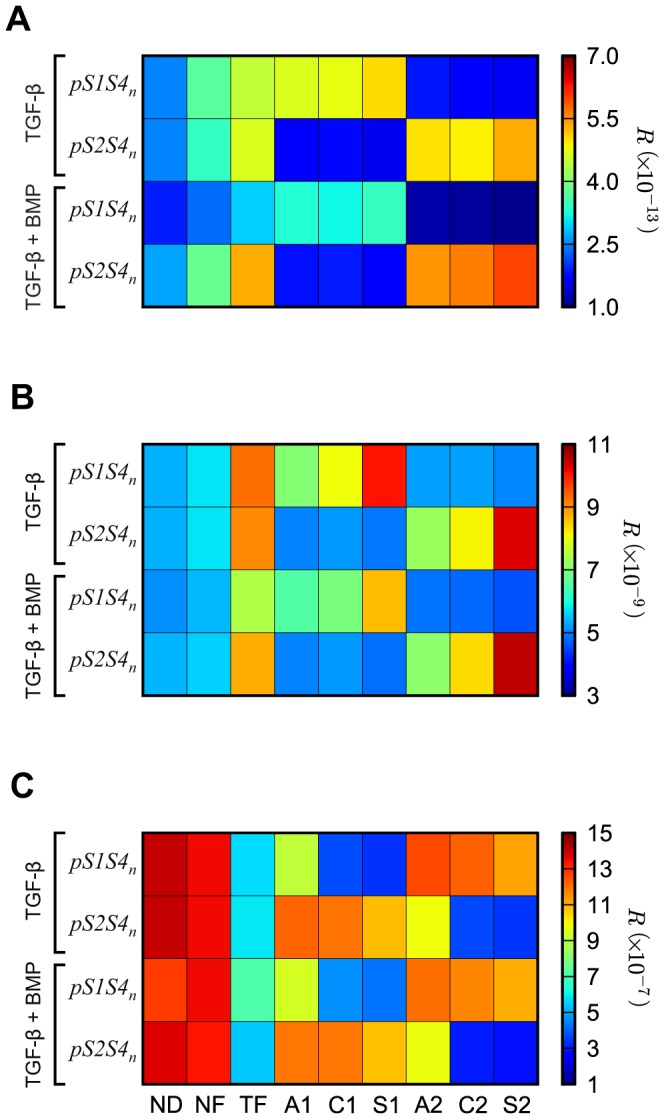
Figure 5. Robustness analysis.

Each negative feedback network motif is assessed for its robustness by computing the value of the robustness measure R (Equation(5)) upon stimulation with TGF-β alone or together with BMP. To represent the model output, we use the (A) peak species concentration (mp metric; Equation(1)), (B) time of the peak species concentration (mt metric; Equation(2)), and (C) signal duration (md metric; Equation(3)) as metrics of the pS1S4n and pS2S4n signal response.
