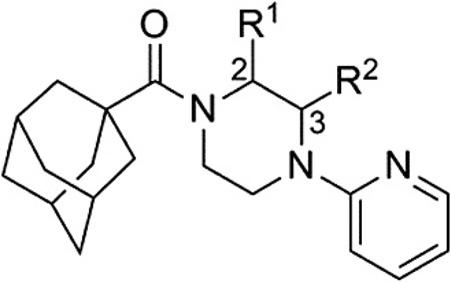
Table 1.
Chiral piperazine analogs
 | |||||
|---|---|---|---|---|---|
| Compd | R1 | R2 | mGlu1 pIC50a (±SEM) | mGlu1 IC50 (nM) | % Glu maxa,b (±SEM) |
| 7 | H | H | 6.20 ± 0.21 | 630 | 1.1 ± 0.8 |
| 14 | (S)-CH3 | H | 5.62 ± 0.18 | 2420 | −1.4 ± 2.5 |
| 15 | (R)-CH3 | H | 6.79 ± 0.15 | 161 | 2.5 ± 0.5 |
| 16 | H | (S)-CH3 | 6.01 ± 0.13 | 988 | 1.8 ± 1.0 |
| 17 | H | (R)-CH3 | 6.78 ± 0.14 | 166 | 2.0 ± 0.4 |
Calcium mobilization mGlu1 assay; values are average of n≥3.
Amplitude of response in the presence of 30 µM test compound as a percentage of maximal response (100 µM glutamate); average of n≥3.
