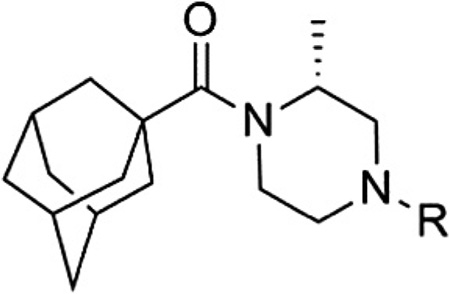
Table 4.
Second generation aryl SAR
 | |||||
|---|---|---|---|---|---|
| Compd | R | mGlu1 pIC50a (±SEM) | mGlu1 IC50 (nM) | % Glu maxa,b (±SEM) | |
| 15 | 6.79 ± 0.15 | 161 | 2.5 ± 0.5 | ||
| 48 |  |
6.59 ± 0.11 | 255 | 2.0 ± 0.4 | |
| 49 | 6.38 ± 0.07 | 414 | 1.3 ± 0.9 | ||
| 50 |  |
6.15 ± 0.05 | 712 | 2.4 ± 0.7 | |
| 46 |  |
6.58 ± 0.06 | 264 | 2.1 ± 0.3 | |
| 51 |  |
6.46 ± 0.14 | 344 | 3.3 ± 1.0 | |
| 52 |  |
5.86 ± 0.04 | 1400 | −0.8 ± 3.3 | |
| 53 |  |
6.40 ± 0.06 | 398 | 0.3 ± 2.2 | |
| 54 |  |
7.01 ± 0.03 | 99 | 2.8 ± 0.3 | |
Calcium mobilization mGlu1 assay; values are average of n≥3.
Amplitude of response in the presence of 30 µM test compound as a percentage of maximal response (100 µM glutamate); average of n≥3.
