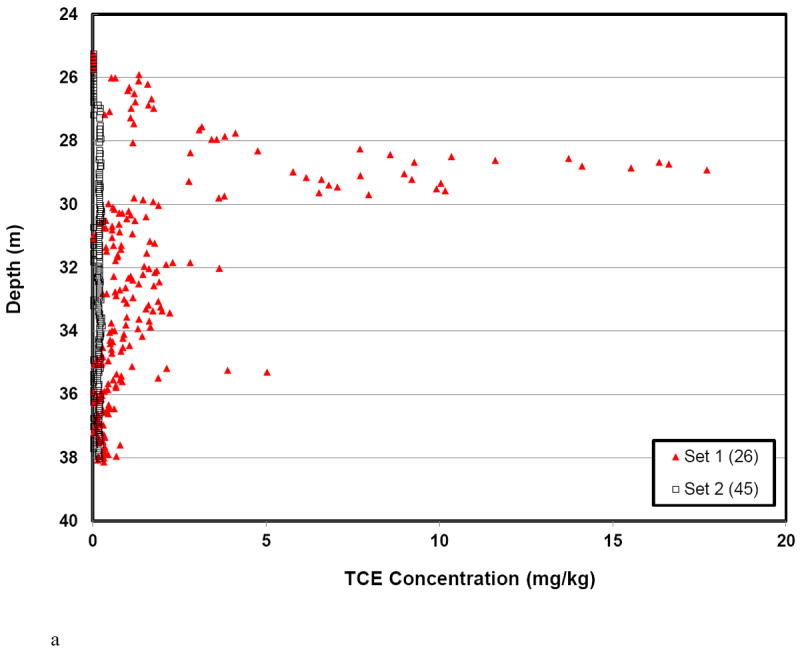
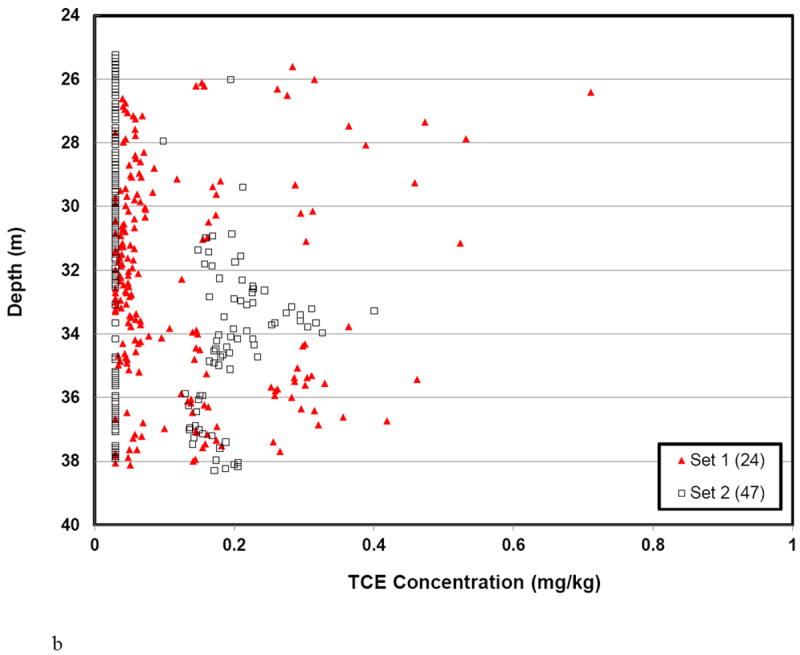
Figure 3.


Sediment-phase trichloroethene (TCE) concentrations for core samples collected in 2008 (set 1) and 2012 (set 2); see Figure 2 for key to locations: a) the most contaminated cores for each set, b) the least contaminated cores for each set. Specific borehole numbers (minus CRA prefix) are noted in parentheses. Note that the paired cores are not co-located.
