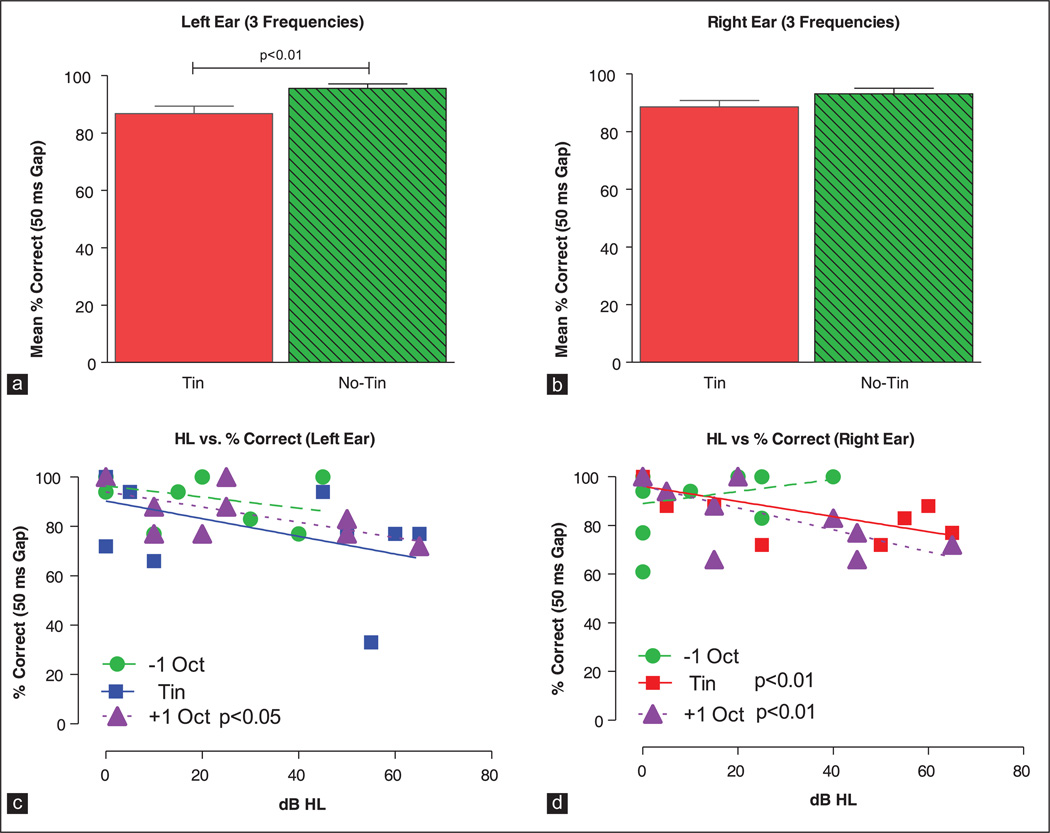
Figure 3.
Mean (standard error of mean [SEM], n = 13) data for tinnitus subjects (3 frequencies, 1-octave below, 1-octave above and at the tinnitus frequency) and no-tinnitus subjects (3 frequencies, 1.2, 8 and 12.6 kHz) for the left ear (a) and right ear (b). Mean scores of tinnitus subjects were significantly less (P < 0.01) than no-tinnitus subjects in the left ear. Scatterplot showing the percent correct detection of 50 ms gaps versus dB HL in the left ear (c) and right ear (d) of tinnitus subjects. Data and linear regression lines are shown for frequencies 1-octave below, 1-octave above and at the tinnitus frequency. significant values for the regression analysis are shown in the legend of each panel

