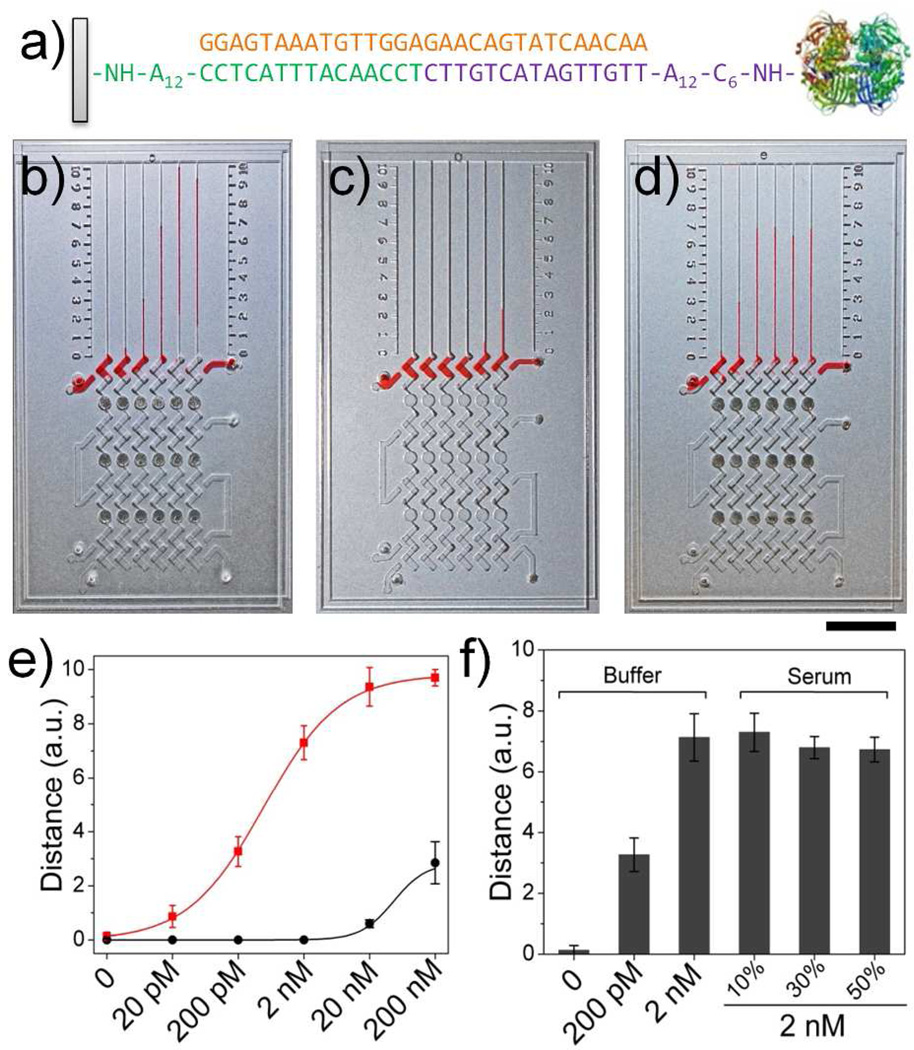
Figure 3.
DNA detection using MV-Chip. (a) The sandwich DNA hybridization structures and 30-nucleotide Ebola virus (EV) sequence used in MV-Chip. (b, c) The images of ink advancement for detection of target DNA with b) or without c) platinum amplification. The concentration in each lane corresponds to the values in (e). (d) From left to right: bar chart advancements for detection of 0, 200 pM, and 2 nM target DNA in buffer and 2 nM target DNA in 10 %, 30 %, and 50 % serum. Dark points are platinum films in (b), (c) and (d). Scale bar is 1cm for b), c), and d). (e) The target DNA calibration curves corresponding to ink advancement with (red) or without (black) platinum amplification at 5 min, with the target DNA concentration varying from 20 pM to 200 nM. f) MV-Chip readouts of 0, 200 pM, and 2 nM target DNA in buffer and 2 nM target DNA in 10 %, 30 %, and 50 % serum. The error bars in e and f represent the s. d. of three measurements.

