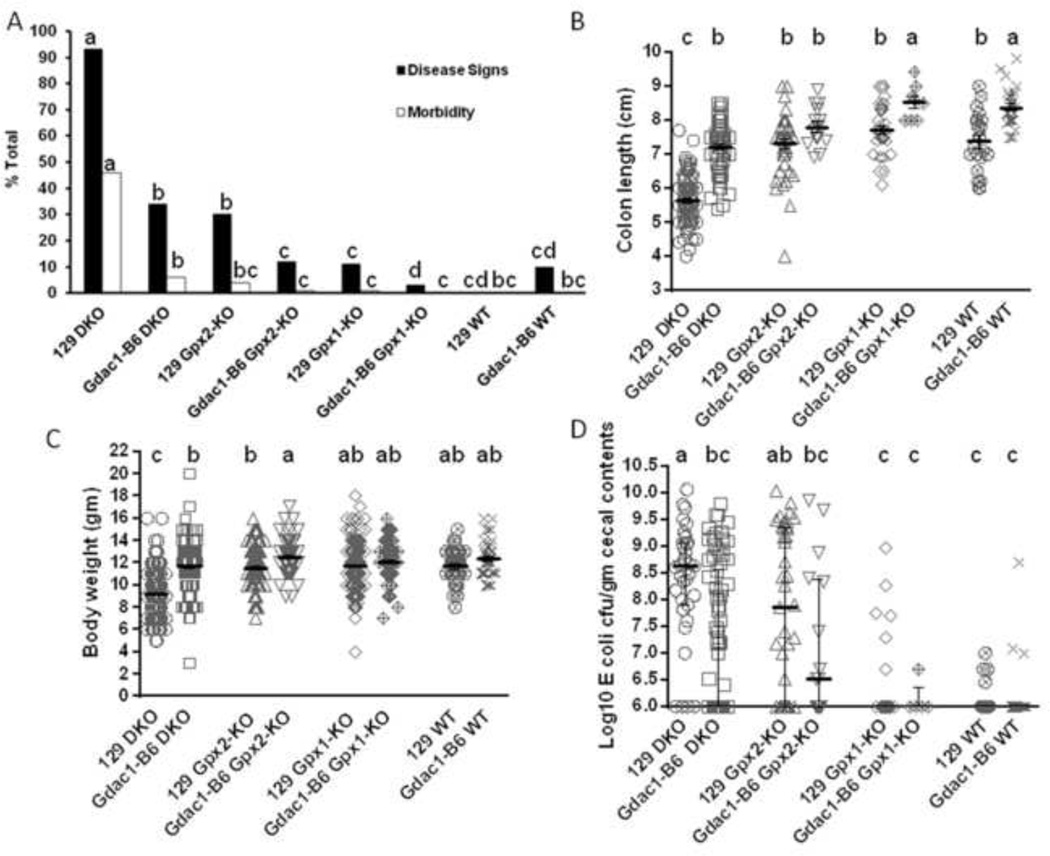
Figure 1.
Impact of the Gdac1 locus on spontaneous colitis in 129 strain mice with and without Gpx1 and Gpx2 deficiency.
A. The percentage of mice that showed colitis disease signs and morbidity at 22 days of age. The Gdac1 effect was analyzed in four groups of mice: Gpx1−/−Gpx2−/− (DKO), Gpx1+/−Gpx2−/− (Gpx2-KO), Gpx1−/−Gpx2+/− (Gpx1-KO) and wild-type (WT) of 129 background that carried either the Gdac1129 (129) or Gdac1B6 locus (Gdac1-B6). The percentages of mice in each group that had disease signs (solid bar) or morbidity (open bar) were analyzed separately. N = 574 129 DKO, 156 Gdac1B6 DKO, 315 129 Gpx2-KO, 80 Gdac1B6 Gpx2-KO, 352 129 Gpx1-KO, 114 Gdac1B6 Gpx1-KO, 30 129 WT and 10 Gdac1B6 WT. Groups with significantly different disease incidence are indicated by different letters, where a>b>c>d. Groups that share a letter are not statistically different (i.e., bc is not different from b or c, and cd is not different from c or d).
B. Scatter dot plot of colon length of mice at 22 days of age. The same genotypes of mice were used as in A. The gray horizontal lines are mean ± SEM. N= 106 129 DKO, 69 Gdac1B6 DKO, 46 129 Gpx2-KO, 15 Gdac1B6 Gpx2-KO, 36 129 Gpx1-KO, 8 Gdac1B6 Gpx1-KO, 22 129 WT and 29 Gdac1B6 WT. Groups with significantly different means are indicated by different letters, where a>b>c. C.
Scatter dot plot of mouse body weight of mice at 22 days of age. The gray lines with error bars indicate mean ± SEM. N= 339 129 DKO, 147 Gdac1B6 DKO, 193 129 Gpx2-KO, 72 Gdac1B6 Gpx2-KO, 293 129 Gpx1-KO, 97 Gdac1B6 Gpx1-KO, 36 129 WT and 43 Gdac1B6 WT mice. Groups with significantly different means are indicated by different letters, where a>b>c. Groups that share a letter are not significantly different (i.e., ab is not different from a or b).
D. Scatter dot plot of mouse gut dysbiosis. Gdac1B6 DKO mice had significantly lower E. coli counts than did 129 DKO mice, while 129 Gpx2-KO mice had higher E. coli counts than did Gpx1-KO and WT mice. n = 35 129 DKO, 82 Gdac1B6 DKO, 41 129 Gpx2-KO, 16 Gdac1B6 Gpx2-KO, 38 129 Gpx1-KO, 5 Gdac1B6 Gpx1-KO, 25 129 WT and 29 Gdac1B6 WT mice. The gray horizontal lines with error bars indicate median ± interquartile range. Medians that differ are indicated by different letters, where a>b>c. Groups that share a letter are not statistically different (i.e., ab is not different from a or bc, and bc is not different from c).

