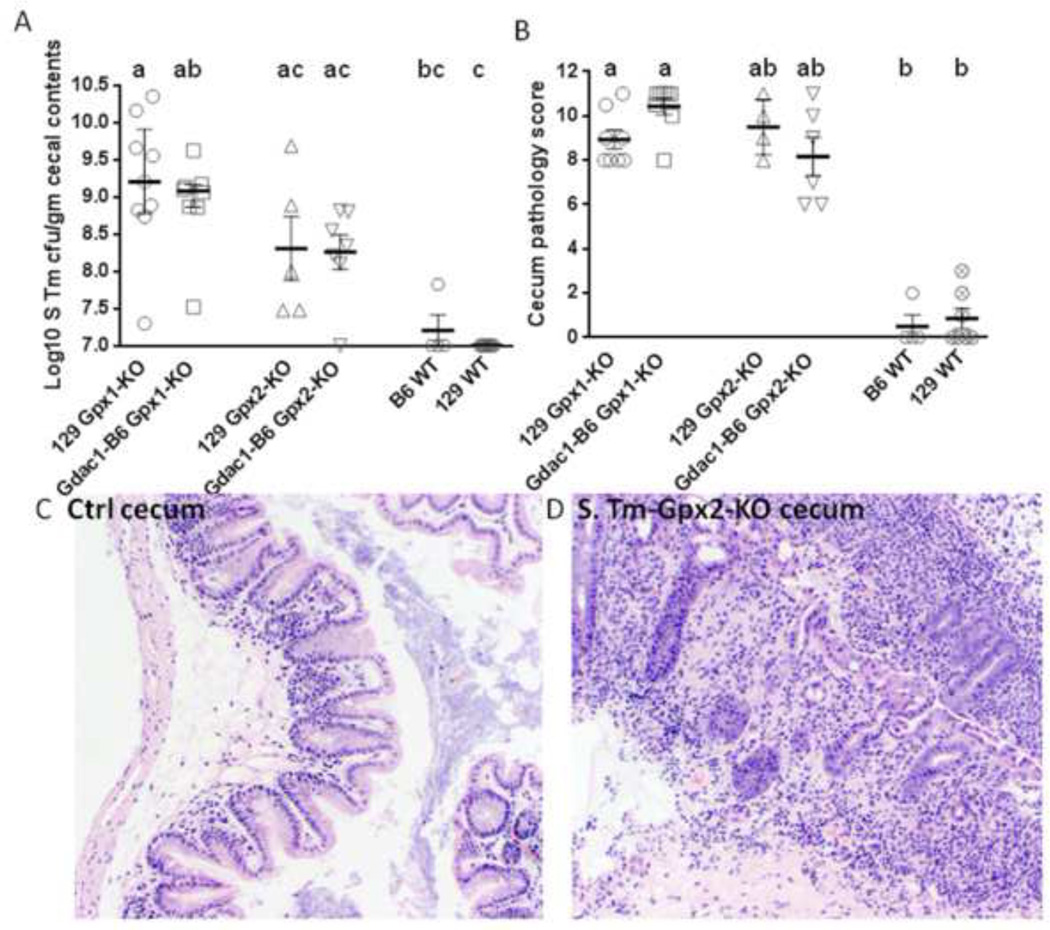
Figure 4.
GPx1 and GPx2, but not the Gdac1 locus, protects mice from S. Tm-induced colitis. Panel A is a scatter dot plot of S. Tm colonization in the cecum of mice pretreated with metronidazole. Each symbol represents one mouse. The horizontal bars are median ± interquartile range. N = 9 129 GPx1-KO, 8 Gdac1-B6 GPx1-KO, 5 129 GPx2-KO, 7 Gdac1-B6 GPx2-KO, 4 WT B6 and 7 129 WT mice. Medians that differ are indicated by different letters, where a>b>c. Groups that share a letter are not a statistically different (i.e., ab is not different from a or b). Panel B shows a scatter dot plot of cecum pathology analyzed at 4 days post S. Tm inoculation. The horizontal lines are median ± interquartile range. N = 8 each of 129 GPx1-KO and Gdac1-B6 GPx1-KO, 5 129 GPx2-KO, 7 Gdac1-B6 GPx2-KO, 4 B6 WT and 7 129 WT mice. Medians that differ are indicated by different letters, where a>b. The control 10 129 Gpx1-KO and 6 Gpx2-KO mice had a median pathology score of 1 (range 0–7). Panels C and D are H&E stained cecum cross section from a non-infected and S. Tm-infected 129 Gpx2-KO mouse, respectively. The S. Tm-infected cecum has many infiltrating cells and distorted glands.

