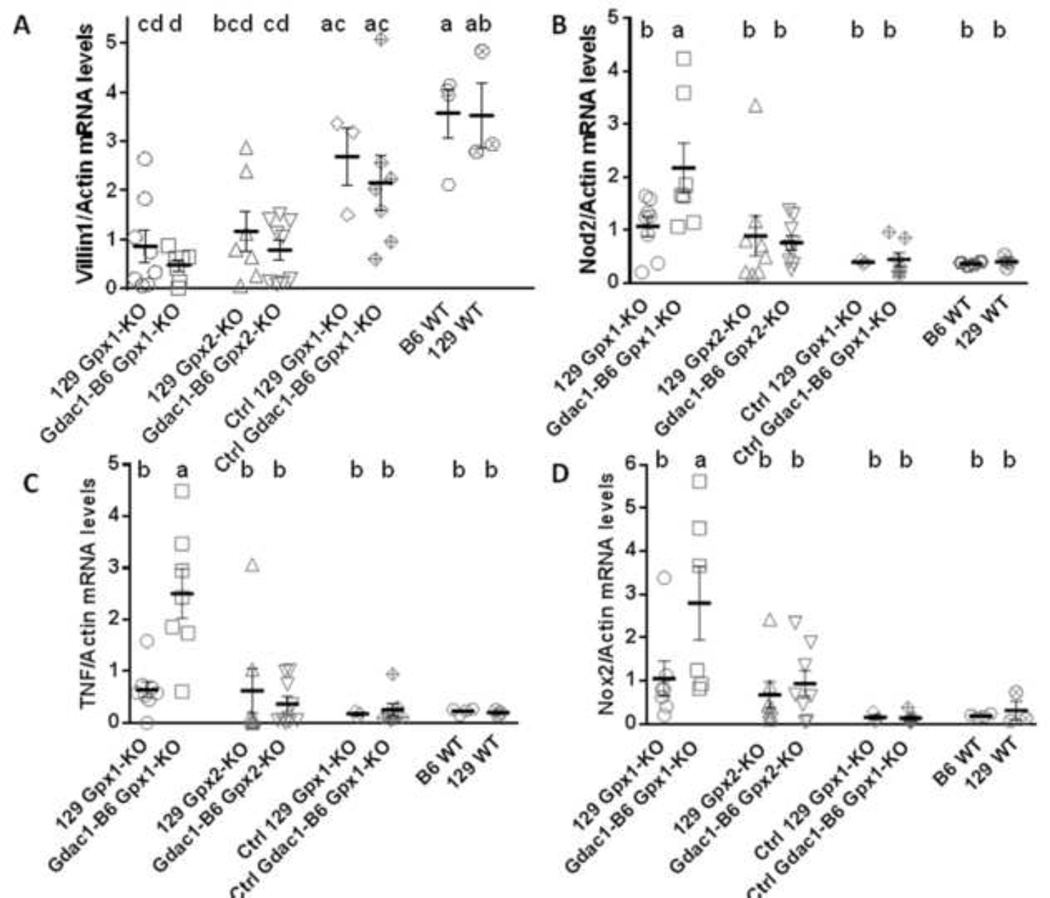
Figure 5.
Scatter dot plot of villin (A), Nod2 (B), Tnf (C) and Nox2 (D) mRNA levels in the cecum of mice after inoculation with S. Tm. Control (Ctrl) 129 GPx1-KO and congenic Gdac1B6 GPx1-KO mice were either pre-treated with metronidazole (Met) without S. Tm inoculation or were inoculated with S. Tm without Met pretreatment. All mRNA was normalized to β-actin. The horizontal lines are mean ± SEM. N = 7–8 129 Gpx1-KO, 6–7 Gdac1-B6 Gpx1-KO, 7–8 129 Gpx2-KO, 8–9 Gdac1-B6 Gpx2-KO, 3 Ctrl 129 Gpx1-KO, 7 Ctrl Gdac1-B6 Gpx1-KO, 4 B6 WT and 3 129 WT mice for all mRNAs. Means that differ are indicated by different letters (where a>b>c). Groups share the same letter are not different (e.g cd is not different from d, bcd or ac).

