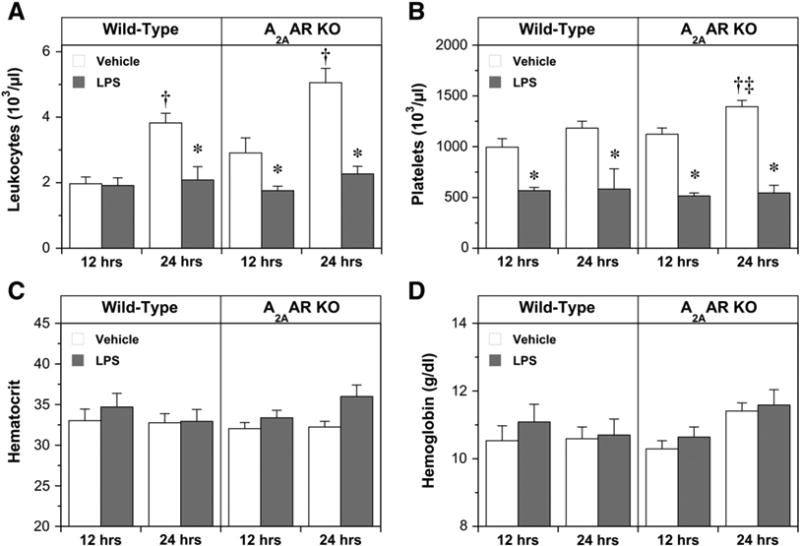
Fig. 4.

Complete blood count parameters at 12 and 24 h following either vehicle or LPS injection in the following treatment groups: Wild-Type, vehicle, 12 h (n = 9); Wild-Type, LPS, 12 h (n = 8); Wild-Type, vehicle, 24 h (n = 8); Wild-Type, LPS, 24 h (n = 6); A2AAR KO, vehicle,12 h(n = 11); A2AAR KO, LPS, 12 h (n = 11); A2AAR KO, vehicle, 24 h (n = 10); A2AAR KO, LPS, 24 h (n = 10). Data are means±S.E.M. * P<0.05 vs. corresponding vehicle value; † P<0.05 vs. corresponding value at 12 h; ‡ P<0.05 vs. corresponding Wild-Type value.
