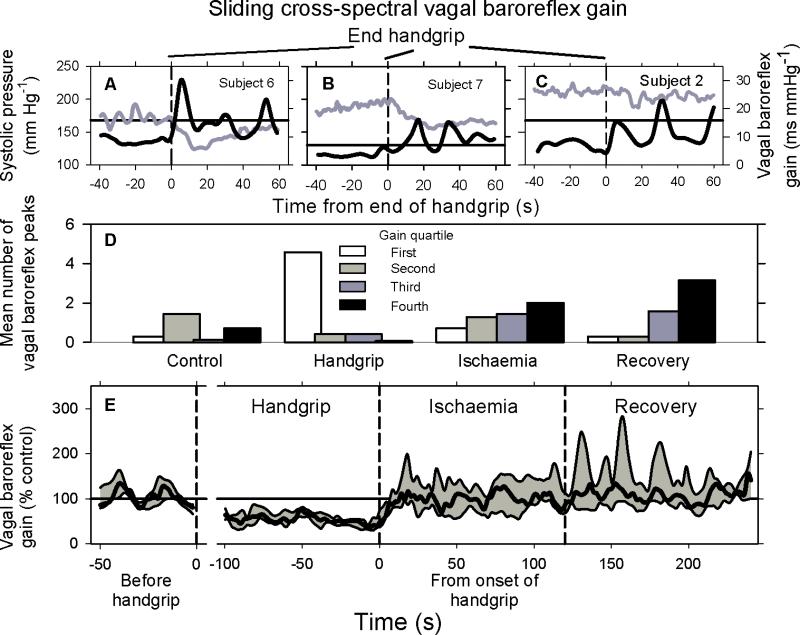
Figure 2.
Vagal baroreflex transfer function gain rhythms. Data shown in Panels A – C were obtained from three subjects different from the one whose responses are shown in Fig. 1. Panel D shows the distribution of median vagal baroreflex gains during 50 s of control measurements, the last 100 s of handgrip (exhaustion), the first 100 s of ischaemia, and the first 100 s of recovery. The magnitudes of all baroreflex gains were divided into quartiles, with the first quartile being the smallest gains, and the fourth quartile being the largest gains. The number of baroreflex peaks falling within each period was determined for each subject, and the percentage of this number falling within each quartile for each measurement period was calculated. Panel E shows median (heavy black line), and 25th and 75th percentile (gray shading) measurements during the periods indicated.

