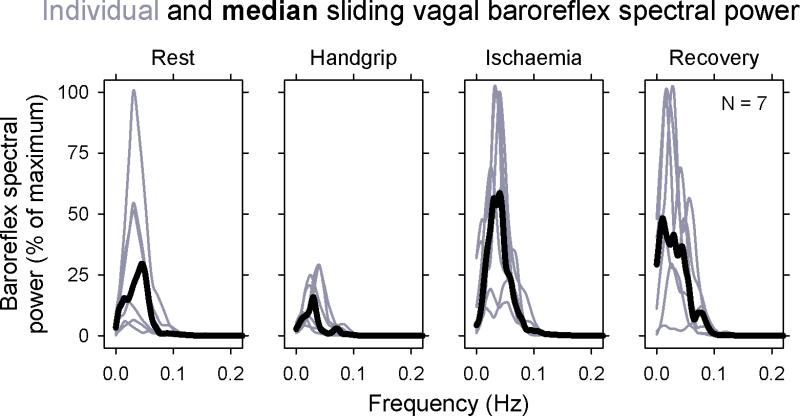
Figure 3.
Sliding transfer function vagal baroreflex spectral power for all subjects. Individual measurements are shown in gray and median values are shown in black. The period of control measurements was 50 s; all other periods were 100 s. Despite very low values of baroreflex gains during handgrip, their frequencies were in the same range as during other parts of the protocol.

