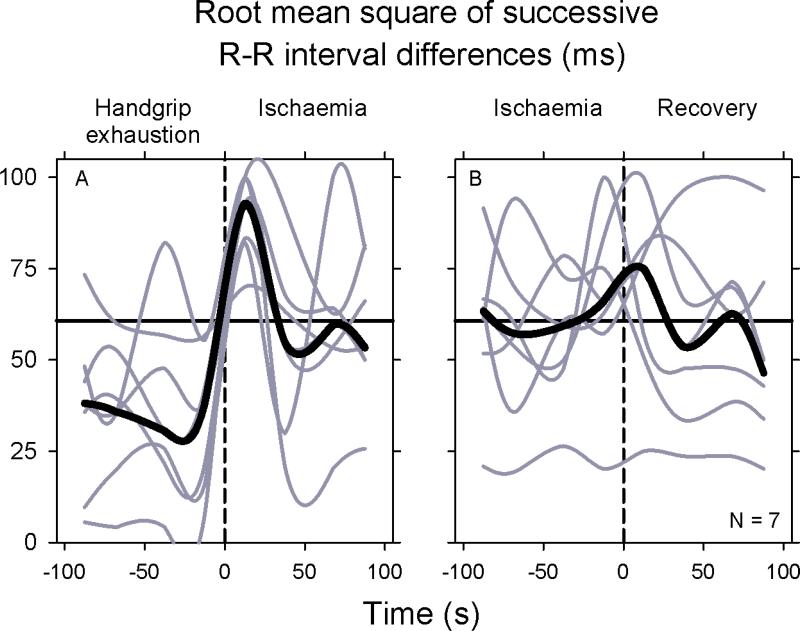
Figure 5.
Individual and median square root of mean squared differences of successive sinus R-R intervals (RMSSD). Individual (gray) and median (black) values were determined at 25 s intervals. These data document major fluctuations of vagal-cardiac nerve activity, which are synchronized as short-lived surges during transitions between exercise and ischaemia, and ischaemia and recovery.

