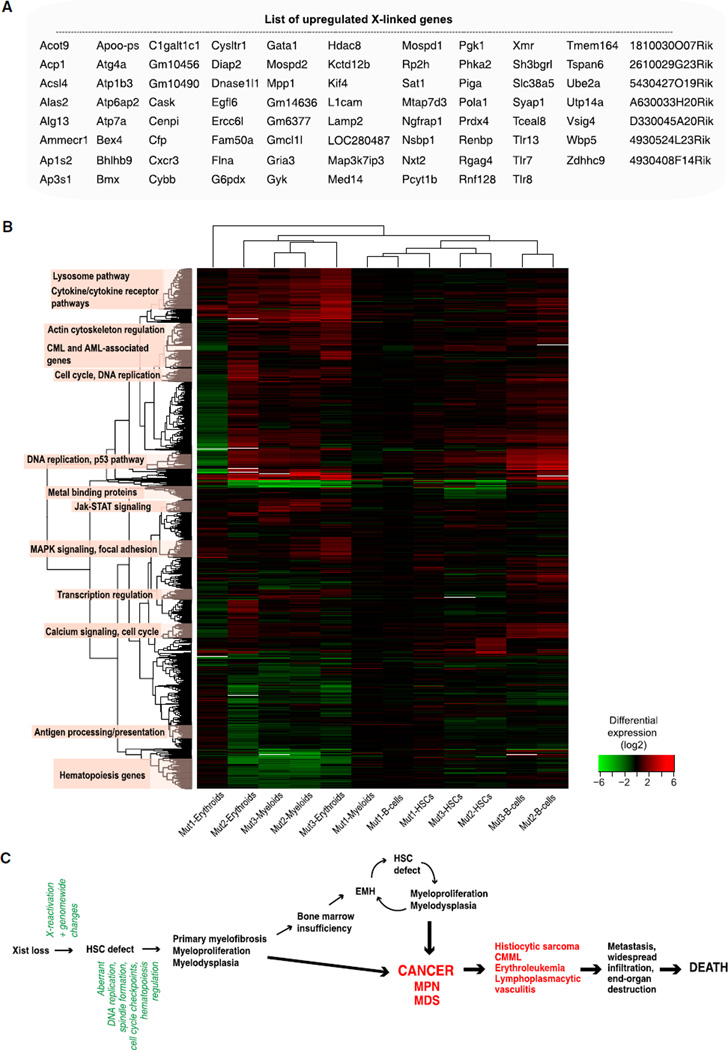
Figure 7. Gene Expression Profiling by Microarray Analysis Reveals X Reactivation and Genome-wide Changes.
(A) List of upregulated X-linked transcripts in blood cells of Xist mutants. See Figure S1A for details.
(B) Hierarchical clustering of transcripts that are differentially expressed between WT and mutant blood cells, as listed in Tables S1B,S1C, and S1D. Enriched functional categories are indicated on left. See also Figure S7 and Tables S1A–S1I.
(C) A model for the pathogenesis and progression of cancer resulting from Xist loss.

