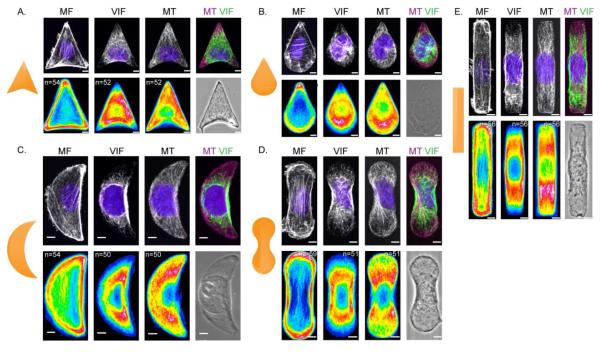
Figure 2. VIF distribution on complex shapes.
Immunofluorescence /phase images of NIH/3T3 cells patterned on 700 μm2 micropatterns. MF, VIF, MT and nuclei (blue) were stained as described in Materials and Methods. Cell population heat maps of MF, VIF and MT were generated using Image J for arrowhead (A), teardrop (B), crescent (C), dumbbell (D) and rod (E) shaped cells. n is the number of cells used to generate the heat map. Scale bar = 5 μm.

