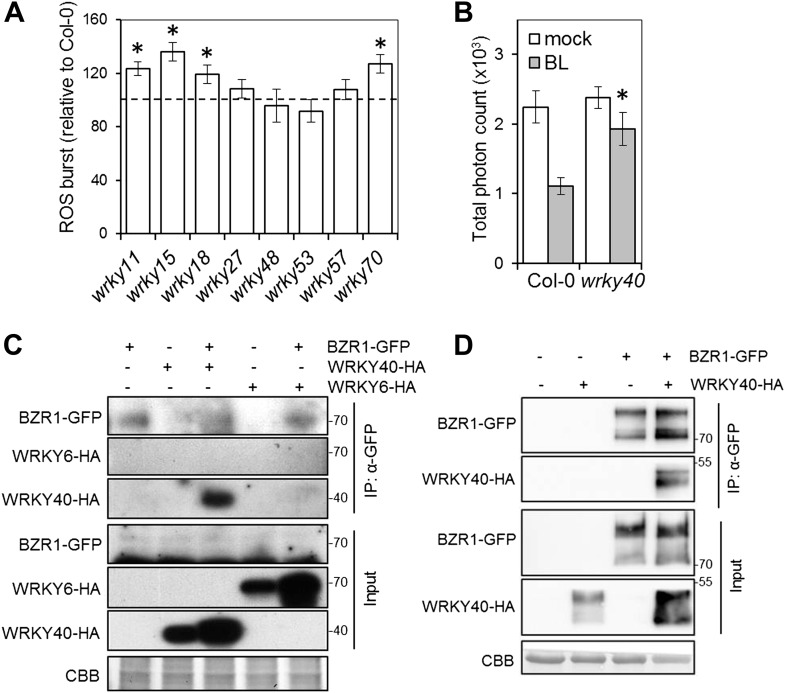
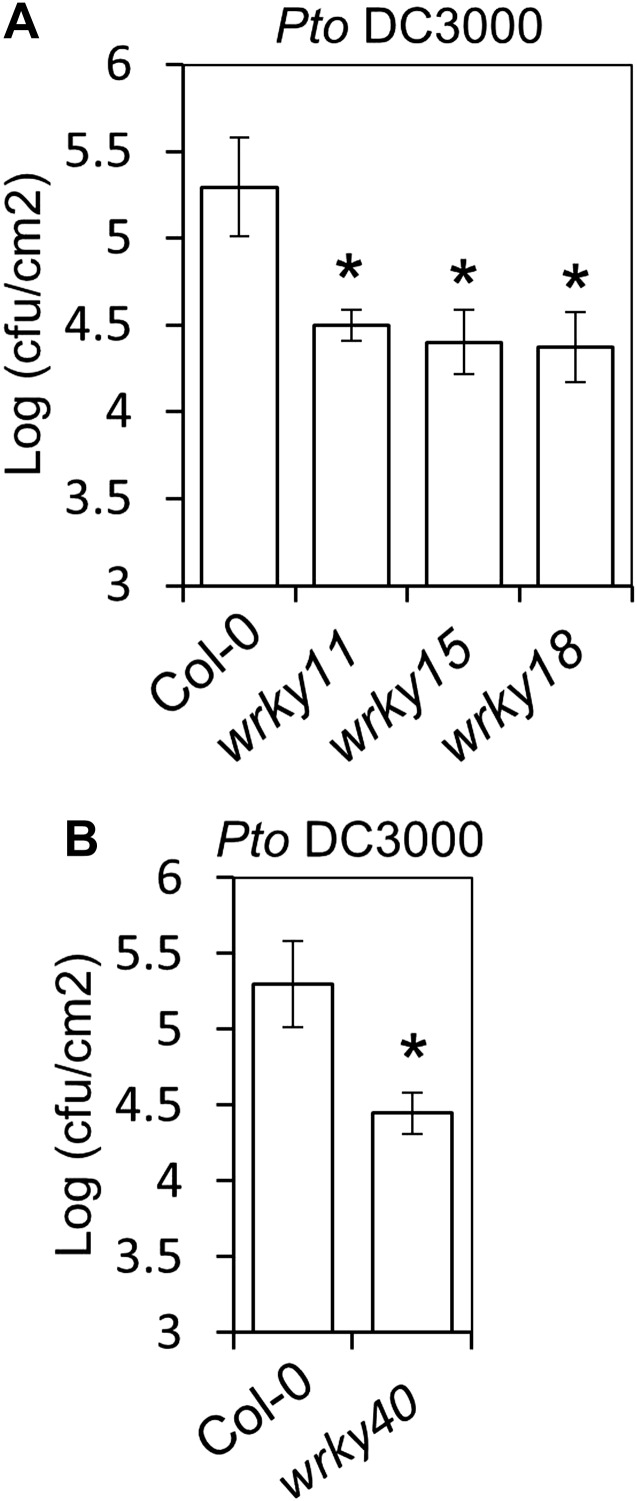
Figure 3. WRKY transcription factors play a dual role on the BR-mediated regulation of PTI signaling.
(A) Flg22-triggered ROS burst in mutants in each BR-induced BZR1-targeted WRKY. Leaf discs of four- to five-week-old Arabidopsis plants were used in these assays. Flg22 was used at a concentration of 50 nM. Total photon counts were integrated between minutes two and 40 after PAMP treatment. Bars represent SE of n = 28. Asterisks indicate a statistically significant difference compared to Col-0 according to a Student’s t-test (p<0.05). (B) Flg22-triggered ROS burst in epiBL (BL)- or mock- pre-treated wrky40 mutant or wild-type plants. Leaf discs of four- to five-week-old plants were pre-treated with a 1 μM BL solution or mock solution for 8 hr. Flg22 was used at a concentration of 50 nM. Total photon counts were integrated between minutes two and 40 after PAMP treatment. Bars represent SE of n = 21. Asterisks indicate a statistically significant difference compared to Col-0 according to a Student’s t-test (p<0.05). (C) Co-IP of BZR1-GFP transiently expressed in N. benthamiana, alone or together with WRKY40-HA or WRKY6-HA. BZR1-GFP was immunoprecipitated with an anti-GFP antibody. Immuniprecipitated or total proteins were separated in a 10% acrylamide gel and transferred to PVDF membranes. Membranes were blotted with anti-HA or anti-GFP antibodies. CBB: Coomassie brilliant blue. (D) Co-IP of BZR1-GFP transiently expressed in Arabidopsis protoplasts, alone or together with WRKY40-HA. BZR1-GFP was immunoprecipitated with an anti-GFP antibody. Immuniprecipitated or total proteins were separated in a 10% acrylamide gel and transferred to PVDF membranes. Membranes were blotted with anti-HA or anti-GFP antibodies. CBB: Coomassie brilliant blue. All experiments were repeated at least twice with similar results.


