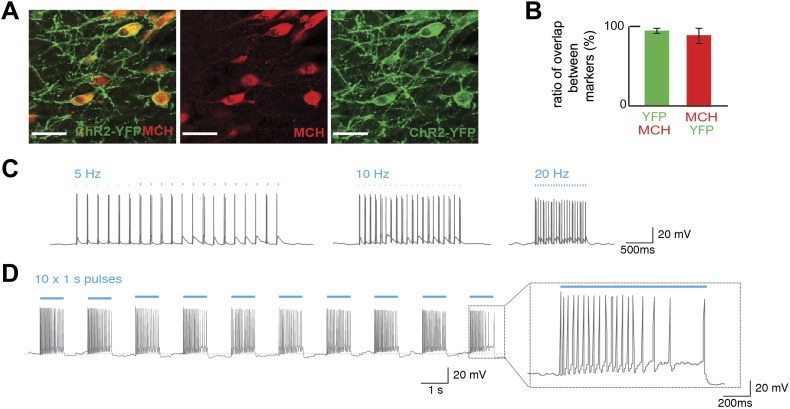
Figure 1. Optogenetic control of MCH neurons.
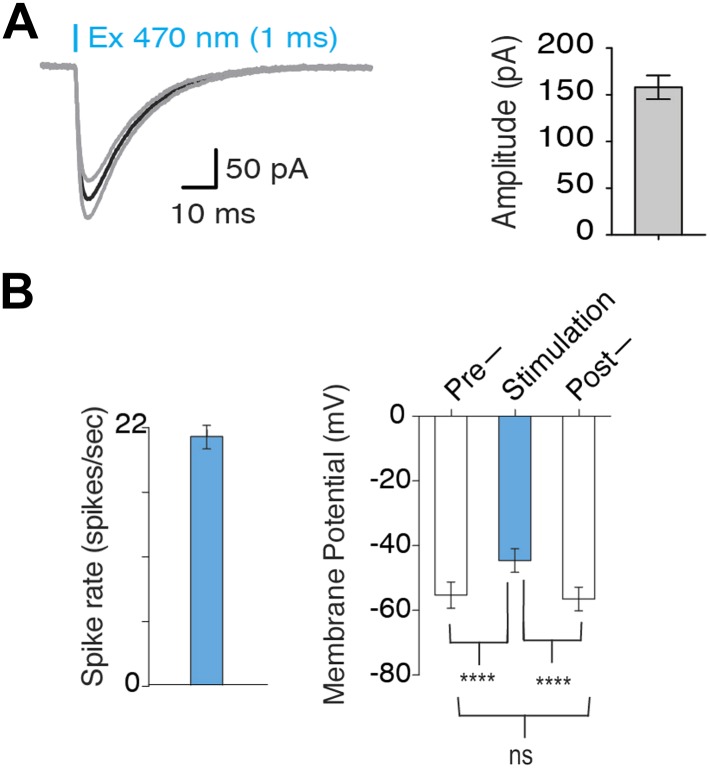
(A) Pmch-CRE mice were mated to Rosa26-LSL-ChR2-YFP, and expression of ChR2-YFP (green—right panel) in MCH neurons (red—middle panel) in the LH are shown individually as well as in a merged panel (left panel); scale bar (Scale bar: 15 µm). (B) Quantification of co-expression of MCH and YFP shows that 97 ± 3% of MCH positive neurons expressed YFP and that 92 ± 8% of ChR2-YFP neurons expressed MCH (n = 1200 cells in four mice). (C) The effect of light stimulation on spike activity, evoked by light stimulation at 5 Hz, 10 Hz, and 20 Hz. (D) The response to 1 s continuous light stimulation, repeated 10 times. Inset, spike train in response to continuous light stimulation similar to what has been described for glucose-induced responses (see text for references and Figure 1—figure supplement 1 for quantification).


