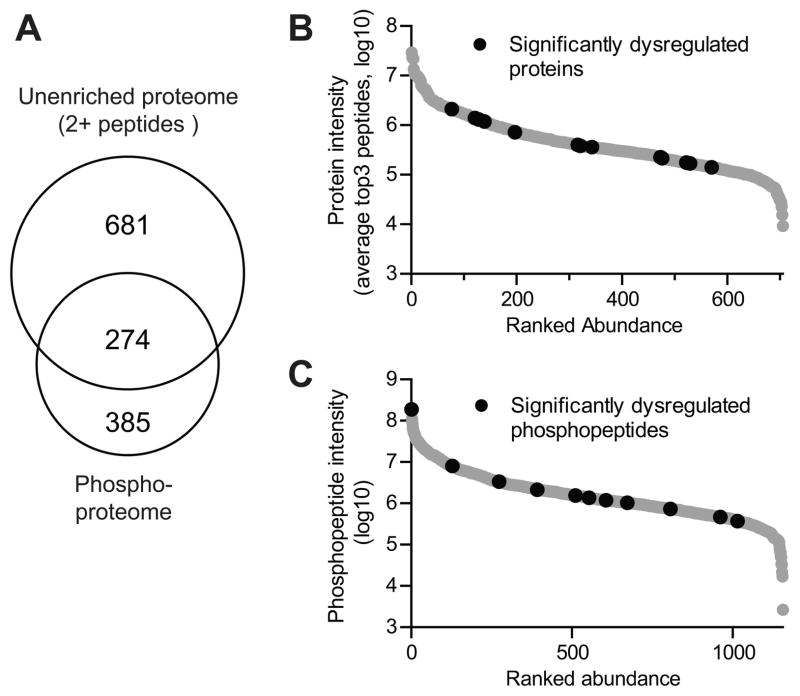
Figure 2.
Summary of quantified proteomes. A, Venn diagram comparing the overlap between proteins quantified with 2+ peptides in the un-enriched sample versus identified proteins in the phosphoproteome B-C, The intensity of quantified proteins (B) and phosphopeptides (C) plotted against ranked abundance. Proteins/phosphopeptides that were significantly different between CVN-AD and WT mice brain lysates at 42 wks of age were determined by using an ANOVA p-value <0.05 and a Cohen’s d effect size > 1.7 as described in the Methods and are denoted with black circles.

