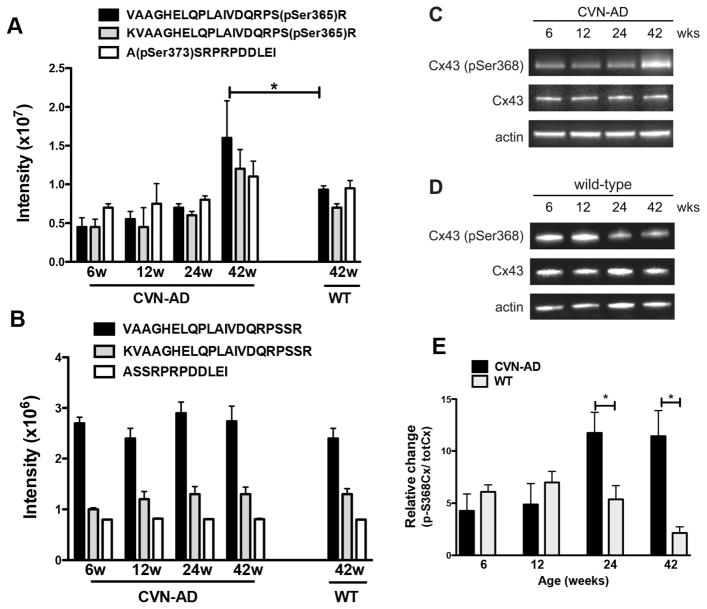
Figure 6.
Phosphorylation of connexin 43 in CVN-AD versus wild-type mice. A, Average intensities of three different CX43 phosphopeptides, corresponding to two unique phospho-sites, pSer365 and pSer373, are shown for CVN-AD mice at 6, 12, 24 and 42wks of age and for WT mice at 42wk of age. Data are mean intensities ± S.E.M. (n=3 per group), **p<0.01 for CVN-AD 42 weeks versus CVN-AD at 6 weeks (one-way ANOVA); * P< 0.05 for CVN-AD mice 42 weeks versus wild-type (pSer365 peptides only; Rosetta Elucidator error model) B, The corresponding intensities of un-enriched Cx43 peptides (containing non-phosphorylated Ser365 and Ser373) are shown for the same brain lysates as in A. Data are mean ± S.E.M. (n=3 per group). C,D, Cx43 phosphorylation at Ser368 and total Cx43 levels were measured by western blot using whole brain lysates at 6, 12, 24 and 42 wks from either CVN-AD (C) or WT (D) mice. Images are representative of triplicate assays for each mouse strain. E, Data represent the average fold change of pSer368 levels in CVN-AD mice with respect to WT mice. Fold change was determined from the ratios of Cx43-Ser368/total CX43 levels for CVN-AD mice compared to Cx43-pSer368/total CX43 levels for WT mice. Phosphorylation of Ser368 at 24 and 42 weeks was significantly higher in CVN-AD. Data are mean ± S.E.M. (n=3 per group), *p<0.05, CVN-AD versus wild-type (student’s t-test).

