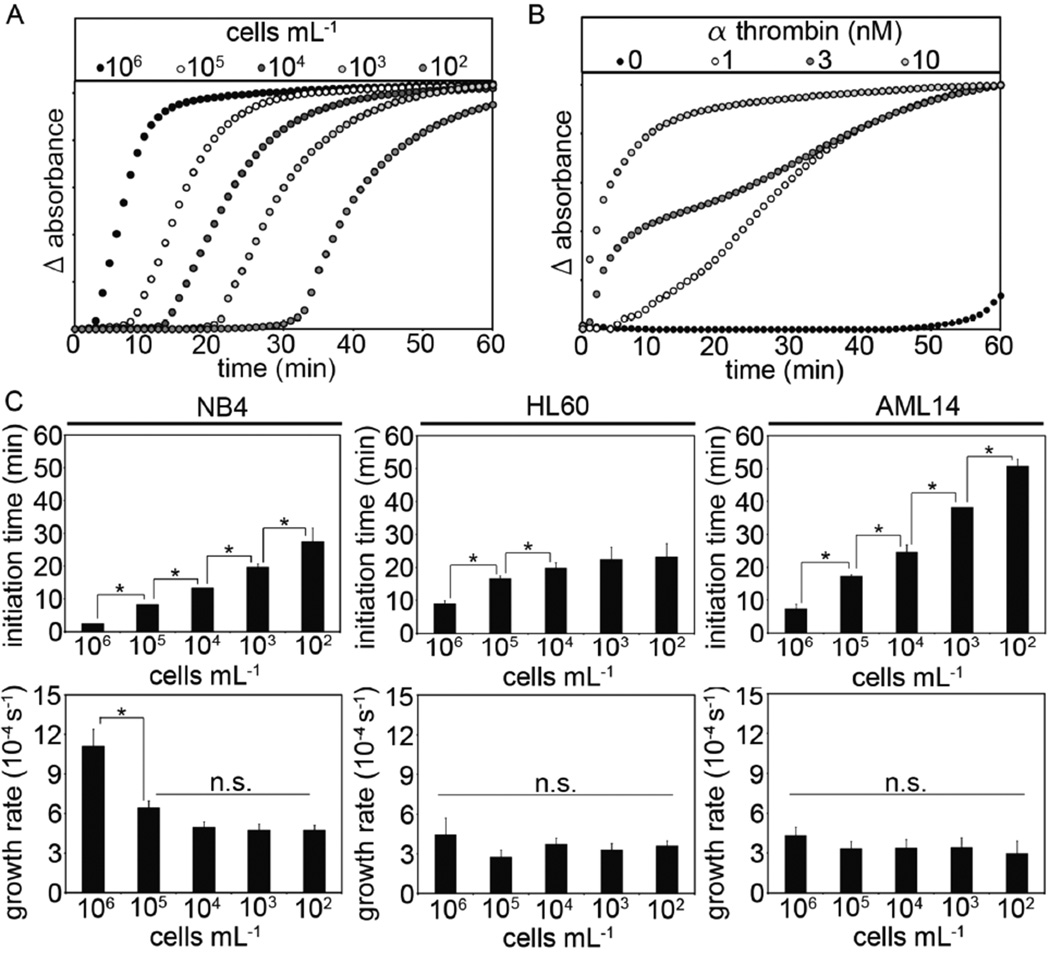
Figure 3.
AML cells were mixed with human pooled plasma (102 to 106 mL−1) prior to recalcification (8.3 mM, final Ca2+ concentration). A representative result for the clot formation assay following the addition of either (A) AML cells or (B) thrombin is shown. Initiation times were recorded as the time at which the absorbance of 405 nM light increased above baseline, and the growth rate measured as the slope of absorbance versus time. (C) Clot initiation times and clot growth rates were measured for NB4, HL60 and AML14 cells at 102 to 106 mL−1 final cell counts. Data are mean ± SE (n = 3). * p<0.05; n.s.=not significant.

