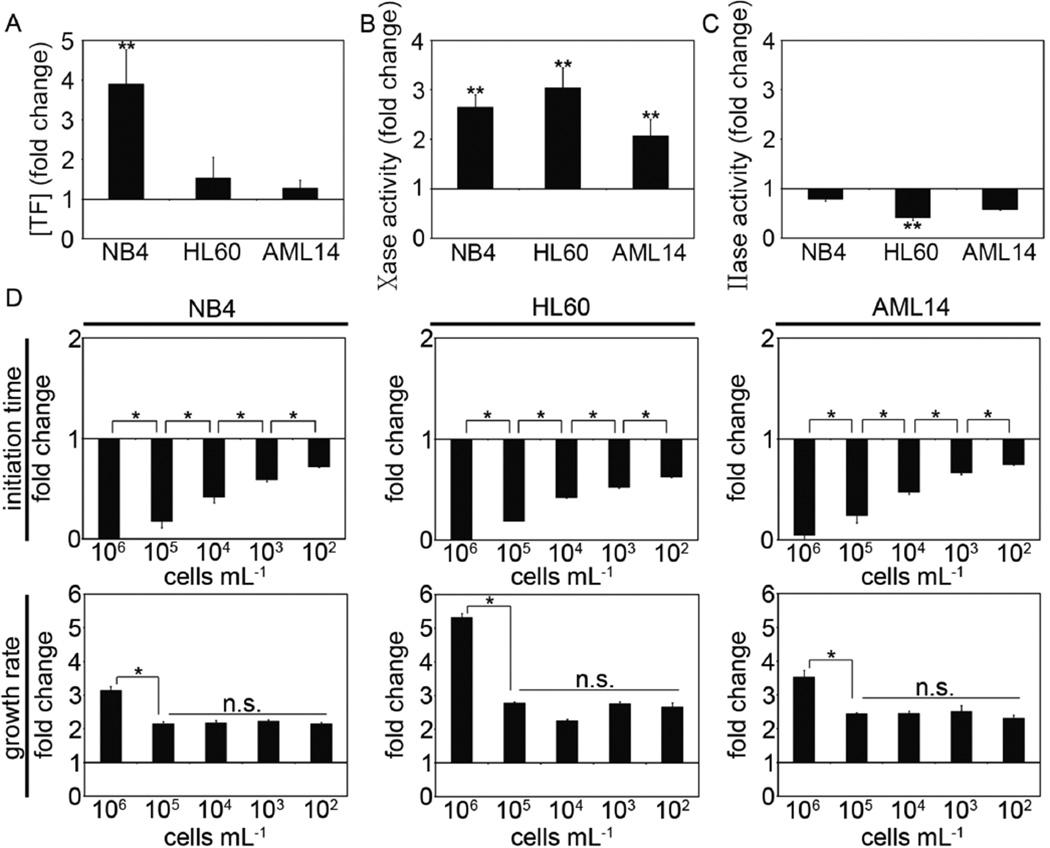
Figure 4.
NB4, HL60 and AML14 cells were treated with daunorubicin (0.2 µg mL−1) for 2 days. (A) TF antigen levels of treated cells were measured with an ELISA. (B) Cells were incubated with FVIIa (10 nM) and the activation of FX (150 nM) was measured by tracking 405 nm light absorbance in the presence of Spectrozyme Xa®. (C) Cells were incubated with FXa (15 nM) and FVa (10 nM) and the activation of prothrombin measured by tracking 405 nm light absorbance in the presence of Spectrozyme TH®. (D) Initiation time and growth rate were measured and shown as the fold-change relative to untreated cells. Data are mean ± SE (n = 3). ** p<0.05 versus untreated cells; ** p<0.05; n.s.=not significant.

