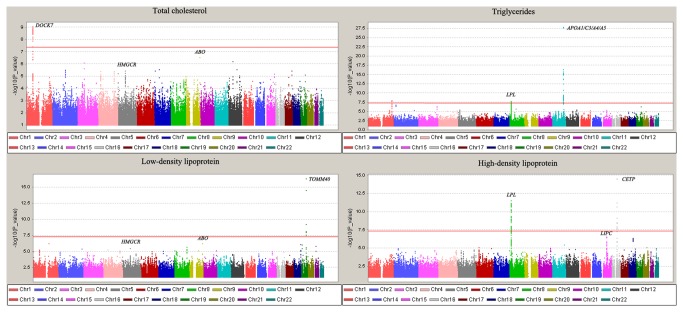
Figure 1. Manhattan plots of a GWAS meta-analysis of lipid levels in a total of 3,451 subjects in a Chinese population.
The horizontal axis shows the chromosomal positions; the vertical axis shows –log10 P values from the linear regression. The red horizontal line represents the significance level of 5.0×10⁻⁸. The genes that are genome wide significant in the combined analysis are indicated with its gene names in this figure.

