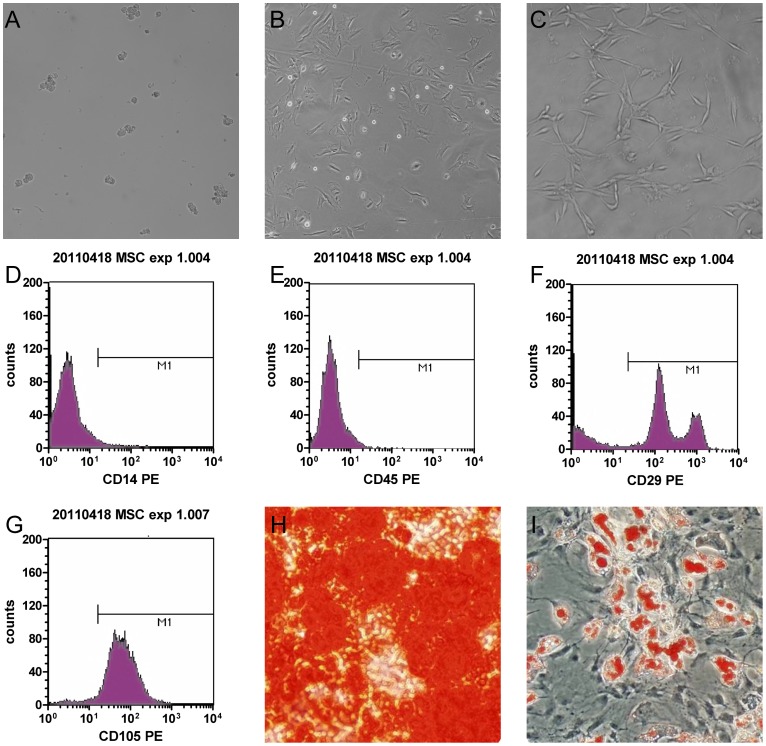
Figure 1. Characterization of rat bone marrow MSCs (α-MEM).
(A) Isolated MSCs were round and small at 2 days after isolation. (B) After three passages, MSCs became larger and multiangular. (C) Before use, MSCs were mostly found in the clostridial form. (D, E, F, G) Fluorescent immunocytostaining showed that cultivated cells expressed CD29, strongly expressed CD105 and did not express CD14 and CD45. (H) Osteocyte lineage differentiation potential was determined by Alizarin Red S staining. (I) Oil Red O staining indicated the accumulation of oil droplets in cells that differentiated to adipocytes.

