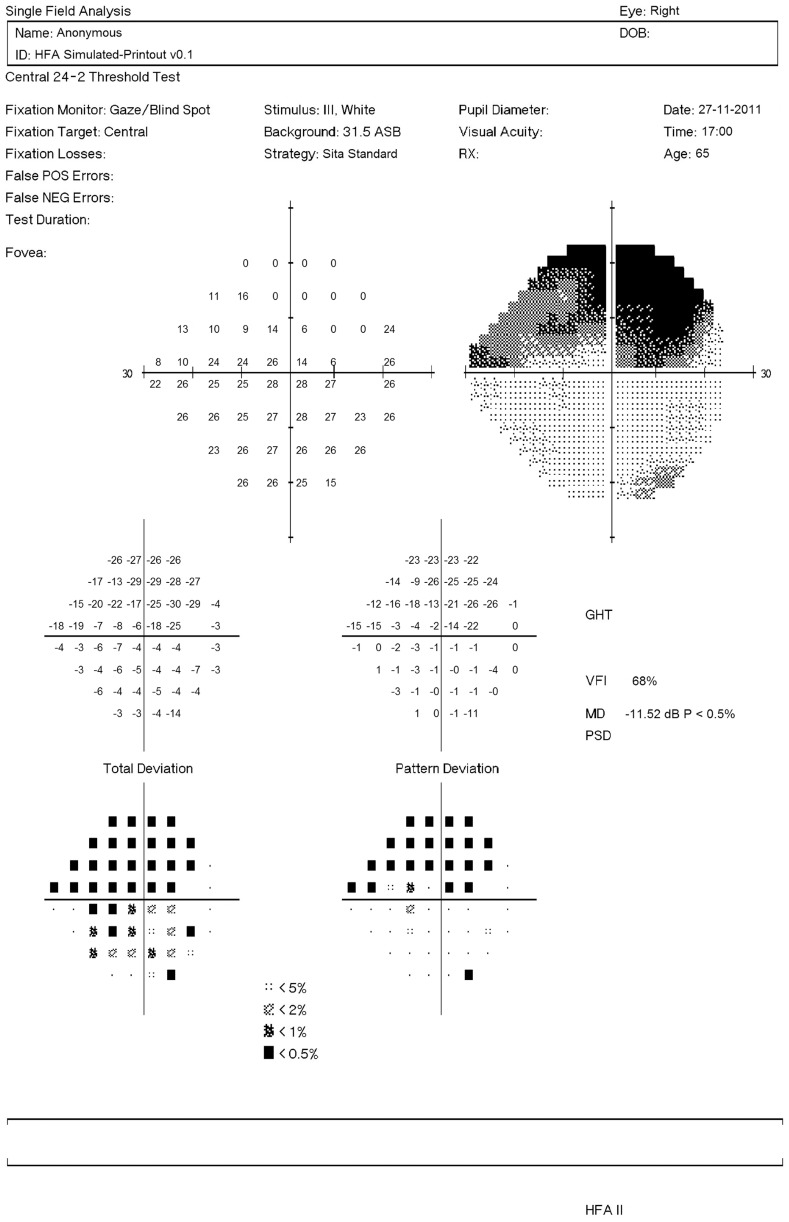
Figure 3. Simulated VF shown as a HFA-like printout.
The grid of numbers in the top left represent the simulated sensitivities; while the adjacent grayscale plot provides a graphical representation of the VF (darker areas represent defects). The number grids below represent the difference in the patient's VF sensitivities and those of a healthy individual of the same age: without correction for a general reduction in retinal sensitivity (‘Total Deviation’); and with correction (‘Pattern Deviation’). Below these two grids are probability maps, which indicate whether the reductions in sensitivities are significant.

