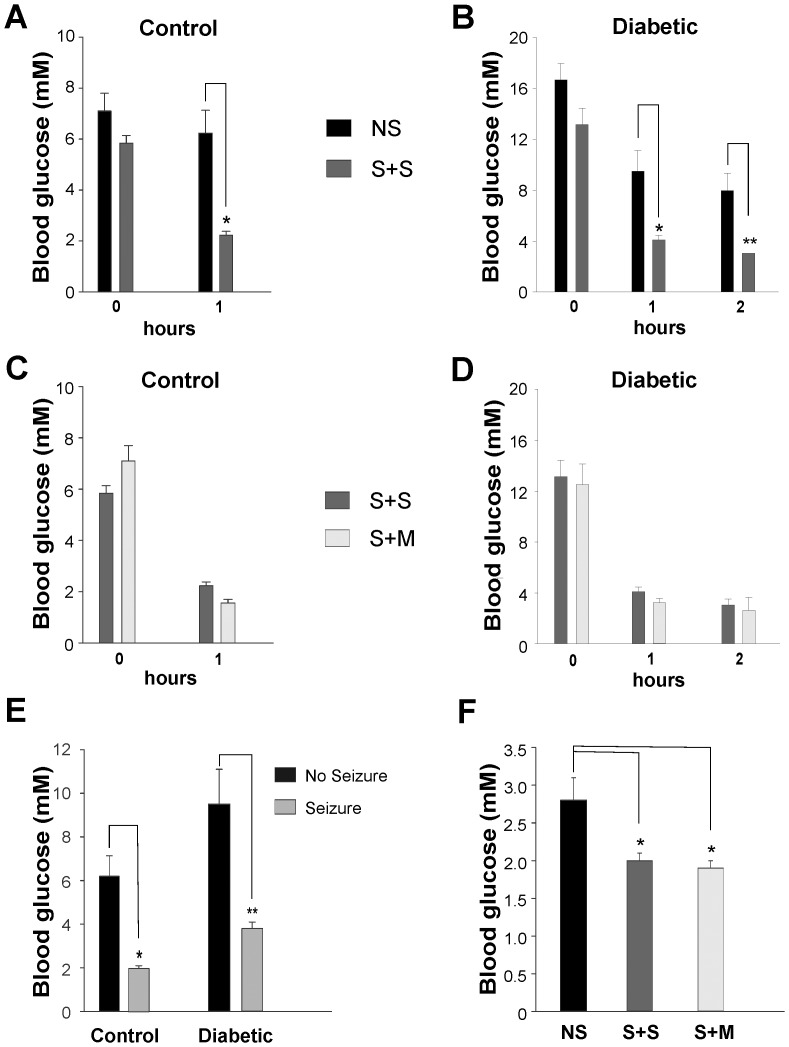
Figure 2. Relationship of blood glucose (BG) decrease after insulin IP (15 u/kg) to seizure and survival.
A: No significant difference in BG of CON rats with or without seizures at 0hr (time of insulin administration). At 1 hr, BG in non-seizure (NS) group was significantly higher (*) than the seizure + survival (S+S); (p < 0.001) B: No significant difference in BG of STZ rats with or without seizures at 0hr (time of insulin administration). BG in NS group was significantly higher, at 1 hr (*) and 2hr (**) post-insulin, than the S+S group; (p < 0.001) C: No significant difference in BG of CON rats at 0hr or 1hr post-insulin in S+S and S+M groups D: No significant difference in BG of STZ rats at 0hr, 1hr or 2hr post-insulin in S+S and S+M groups E: BG levels at 1 hr post-insulin is significantly greater in CON; NS: 6.2±0.9 mM than CON with seizure: 2.0±0.1 mM (*), and in STZ; NS: 9.5±1.6 mM compared with STZ with seizure: 3.8±0.3 mM (**); (p<0.001) F: Lowest BG measured is significantly higher in the NS group (n = 6): 2.8±0.3 mM compared with either S+S (n = 24): 2.0±0.1 mM or S+M (n = 13): 1.9±0.1 mM groups (*); (p<0.002).

