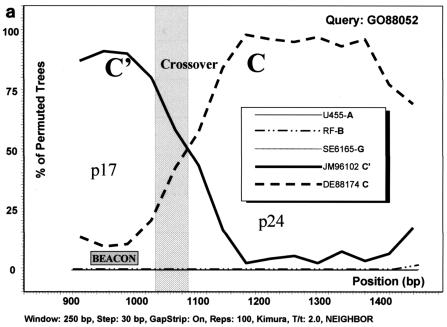
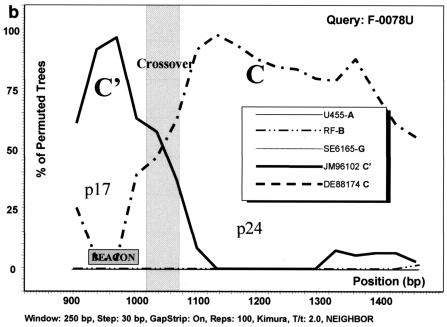
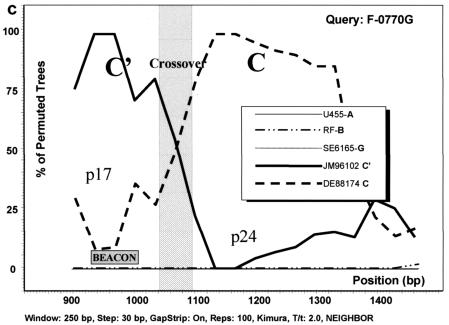
FIG. 3.
Analysis of C/C′ recombinant isolates by bootscanning, based on the neighbor-joining tree and Kimura 2 parameter methods with bootstrapping. The bootstrap values that supported the clustering of the sample sequences with the references are plotted. The chosen window size was 200 nt, moving in steps of 20 nt along the alignment, and the region of the gag gene studied was defined by nt 856 to 1587 of HXB2. (a) Isolate GO88052. (b) Isolate F-0078U. (c) Isolate F-0770G. The isolates UG455 (subtype A), RF (subtype B), and SE6165 (subtype G) together with DE88174 (Ethiopian subtype C) and JM96102 (Ethiopian subtype C′) were used as references. The plot analysis illustrates a crossover point between the p17 and p24 proteins in the gag gene, noted by shading, with the solid line identifying genotype C and the broken line identifying genotype C′. The shaded square shows the position of the beacon.


