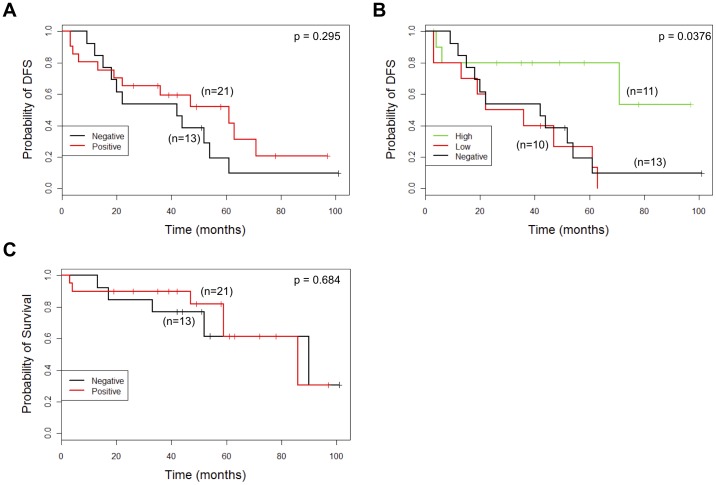
Figure 5. Kaplan-Meier curves for DFS (A, B) and OS (C) in the HER2 overexpressing subtype of IBC categorized according to Dicer expression.
(A, C) Dicer expression is categorised as negative (intensity score 0) and positive (intensity scores 1, 2 and 3). (B) Dicer expression is categorised as negative (intensity score 0), low (intensity score 1) and high (intensity score 2 and 3).

