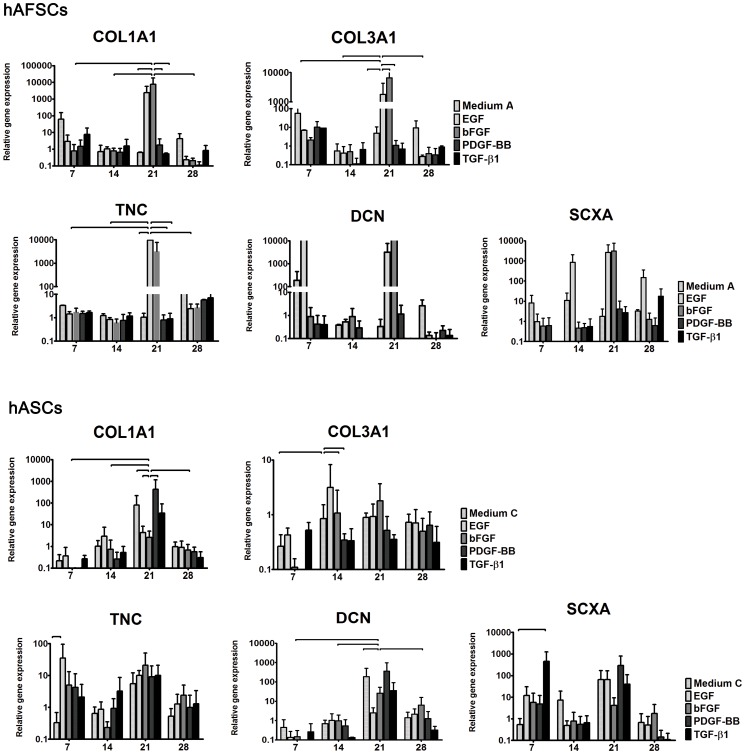
Figure 3. Real time RT-PCR analysis.
Expression of tenascin C (TNC), decorin (DCN), collagen type I (COL1A1), collagen type III (COL3A1) and scleraxis (SCXA) genes in hAFSCs and hASCs cultured in different supplemented media. The x axis represents the culture time, namely 7, 14, 21 and 28 days. The relative gene expression is represented in the y axis. Horizontal lines represent differences statistically significant for p<0.05.

