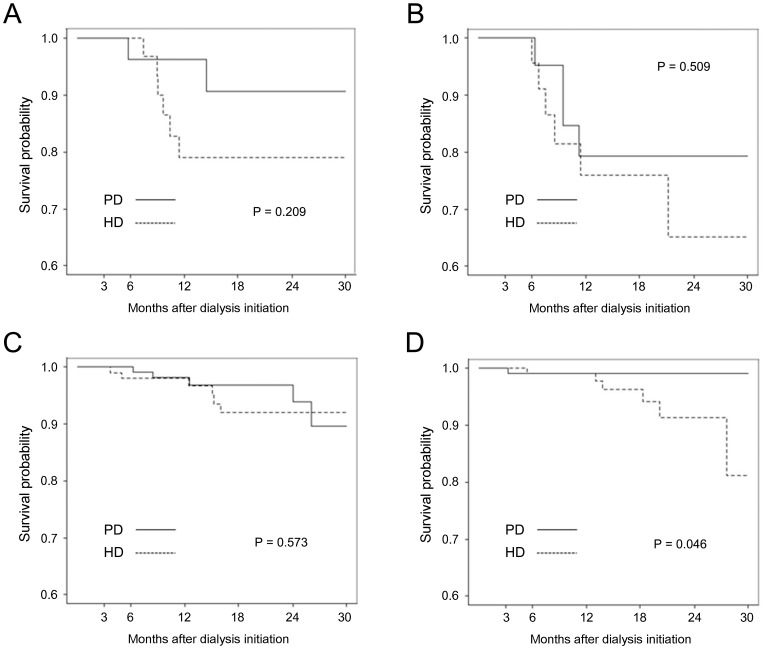
Figure 2. Kaplan-Meier curve according to age and presence of diabetes in propensity-score matched population.
(A) age ≥65 years with diabetes; (B) ≥65 years without diabetes; (C) <65 years with diabetes; (D) <65 years without diabetes A ≥65 years, DM B ≥65 years, non-DM C <65 years, DM D <65 years, non-DM.

