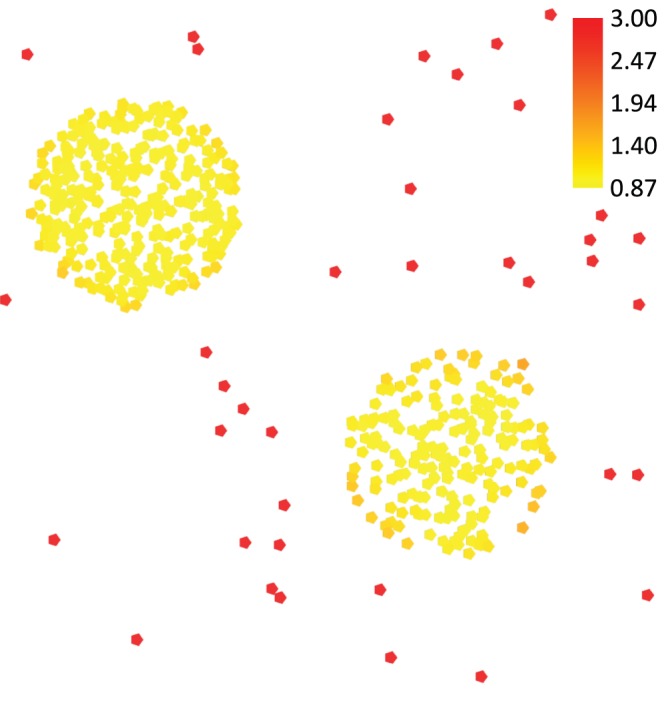
Figure 4. Color-coded visualization of Local Outlier Factors (LOFs) for a set of points in 2D.

For the points, LOFs have been computed that indicate how outlying the points are compared to their k-most similar tracts. The points are color-coded with the values of their respective LOFs, whilst yellow denotes low and red high LOF values.
