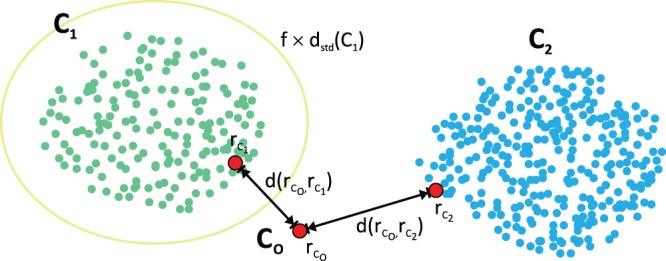
Figure 7. Assignment and reassignment of tracts in CATSER.

Given the prototype clusters  ,
,  , the solitary cluster
  and the carefully selected subset of representatives
  , the closest cluster to
  is
is  since
since  . The representatives with the shortest distance are denoted as
  and
and  .
.  is then (re-) assigned to the closest cluster
  only if the distance
  is smaller than
  , whilst
  is the standard deviation of the distances between all representatives in
  .
.
