
Figure 11. Example for an atlas class in the probabilistic white matter atlas.
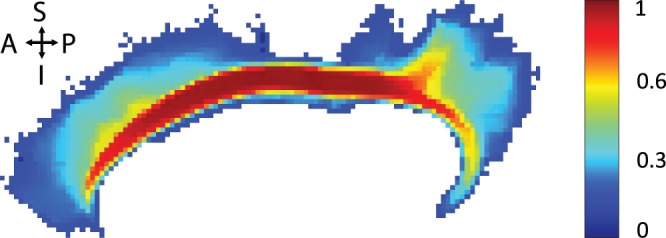
The maximum intensity projection of the probabilities is shown as a pseudo color image for the gyrus part of the left cingulum (CGC ). Regions with high probability (
 ) are colored in red, while regions with low probability (
 ) are shown in blue.