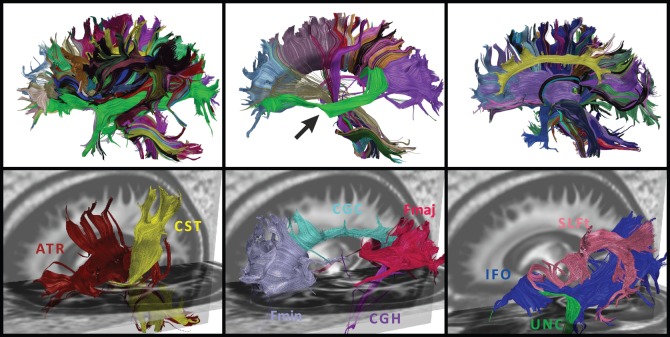
Figure 13. Atlas-guided clustering results for one dataset, clustered with the combined distance measure.
In the top row all bundles are presented. Fiber bundles are shown for the left hemisphere (left image), bundles that cross the hemispheres (middle image) and bundles of the right hemisphere (right image). Different fiber bundles are displayed in distinct colors. In the middle image a tracking error is present that resulted in a fiber bundle connecting the prefrontal lobe and the corpus callosum (green bundle, marked with an arrow). The bottom row shows the clusters that correspond to the atlas classes that are shown in Figure 12.

