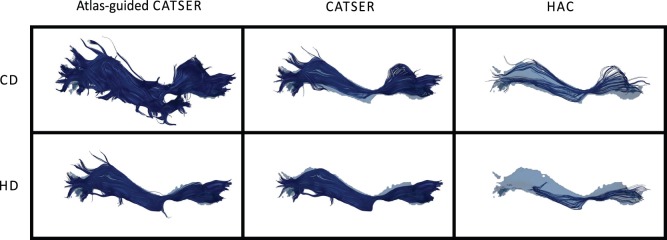
Figure 16. Inferior fronto-occipital fasciculus (IFO) of one dataset clustered with different methods.

The IFO of one dataset is shown, which was clustered with all three methods (atlas-guided CATSER, CATSER, HAC) and both similarity measures (CD, HD). Bundles are shown in the atlas space and are superimposed with the corresponding class of the atlas (in semi-transparent blue). The spatial agreement for the bundles clustered using CD is (from left to right): 0.58; 0.62; 0.69 and for the bundles clustered using HD: 0.75; 0.67; 0.73.
