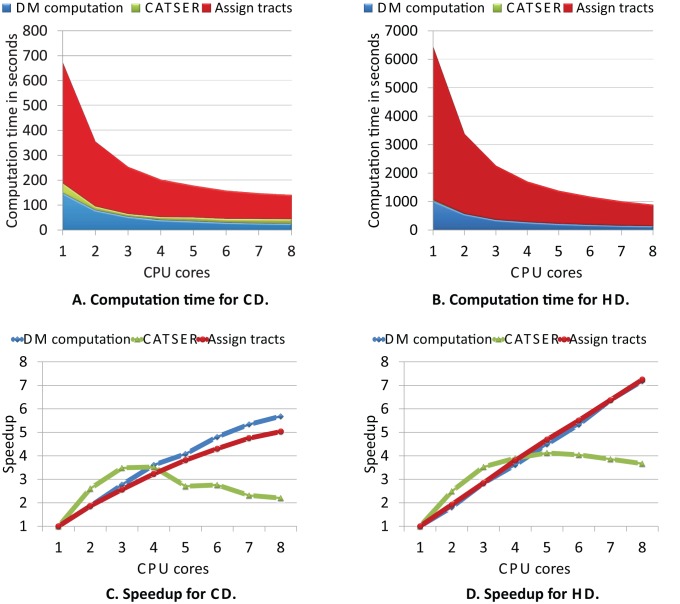
Figure 20. Performance analysis of the cluster analysis for the similarity measures CD (left) and HD (right).
The overall computation time is shown in the top row and the achieved speedup below. For the analysis, the whole clustering process was separated into three distinct parts and analyzed separately (see section “Performance analysis” in Materials and methods). In all plots, each part is highlighted in distinct colors, whereas blue denotes the computation of the distance matrix (part 1: “DM computation”), green the clustering (part 2: “CATSER”) and red the labeling of remaining tracts (part 3: “Assign tracts”). For both distance measures, we observed that part 1 and part 3 were the most time consuming stages during the clustering. By utilizing multiple CPUs during both parts, a high speedup was achieved and the computation time was significantly reduced. While the speedup is nearly optimal for HD, the speedup for CD is slightly reduced. However, the overall processing speed for CD is still 10 times faster.

