Figure 6.
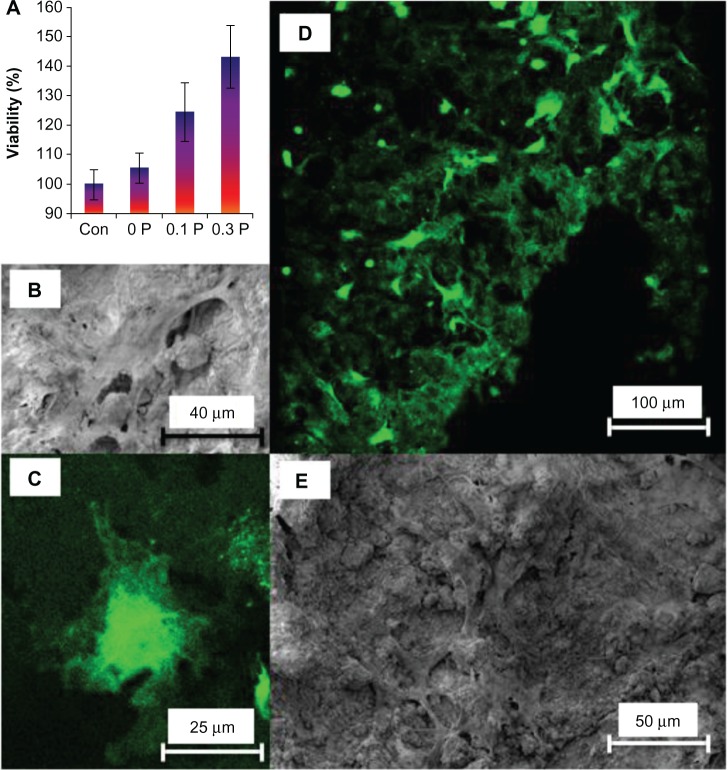
(A) Cytoplasmic content of human mesenchymal stem cells on the 0 P, 0.1 P, and 0.3 P scaffolds in comparison to tissue culture plastic (control sample) shows that the number of viable cells increases by increasing the poly(3,4-ethylenedioxythiophene) poly(4-styrene sulfonate) concentration in the composition of scaffolds. The values are mean ± standard deviation (number of samples =3). (B) Scanning electron microscopy and (C) confocal fluorescent microscopy images of a cell on the 0.3 P scaffold. (D) Scanning electron microscopy and (E) confocal fluorescent image of cell distribution on the 0.3 P scaffold. Enhanced cell attachment is observed for the conductive scaffolds.
Notes: 0 P, 0.1 P, and 0.3 P represent the scaffolds prepared from 0%, 0.1%, and 0.3% (w/w) poly(3,4-ethylenedioxythiophene) poly(4-styrene sulfonate) in the mixture of 10% (w/v) gelatin and 30% (w/v) bioactive glass nanoparticles.
Abbreviation: con, control.

